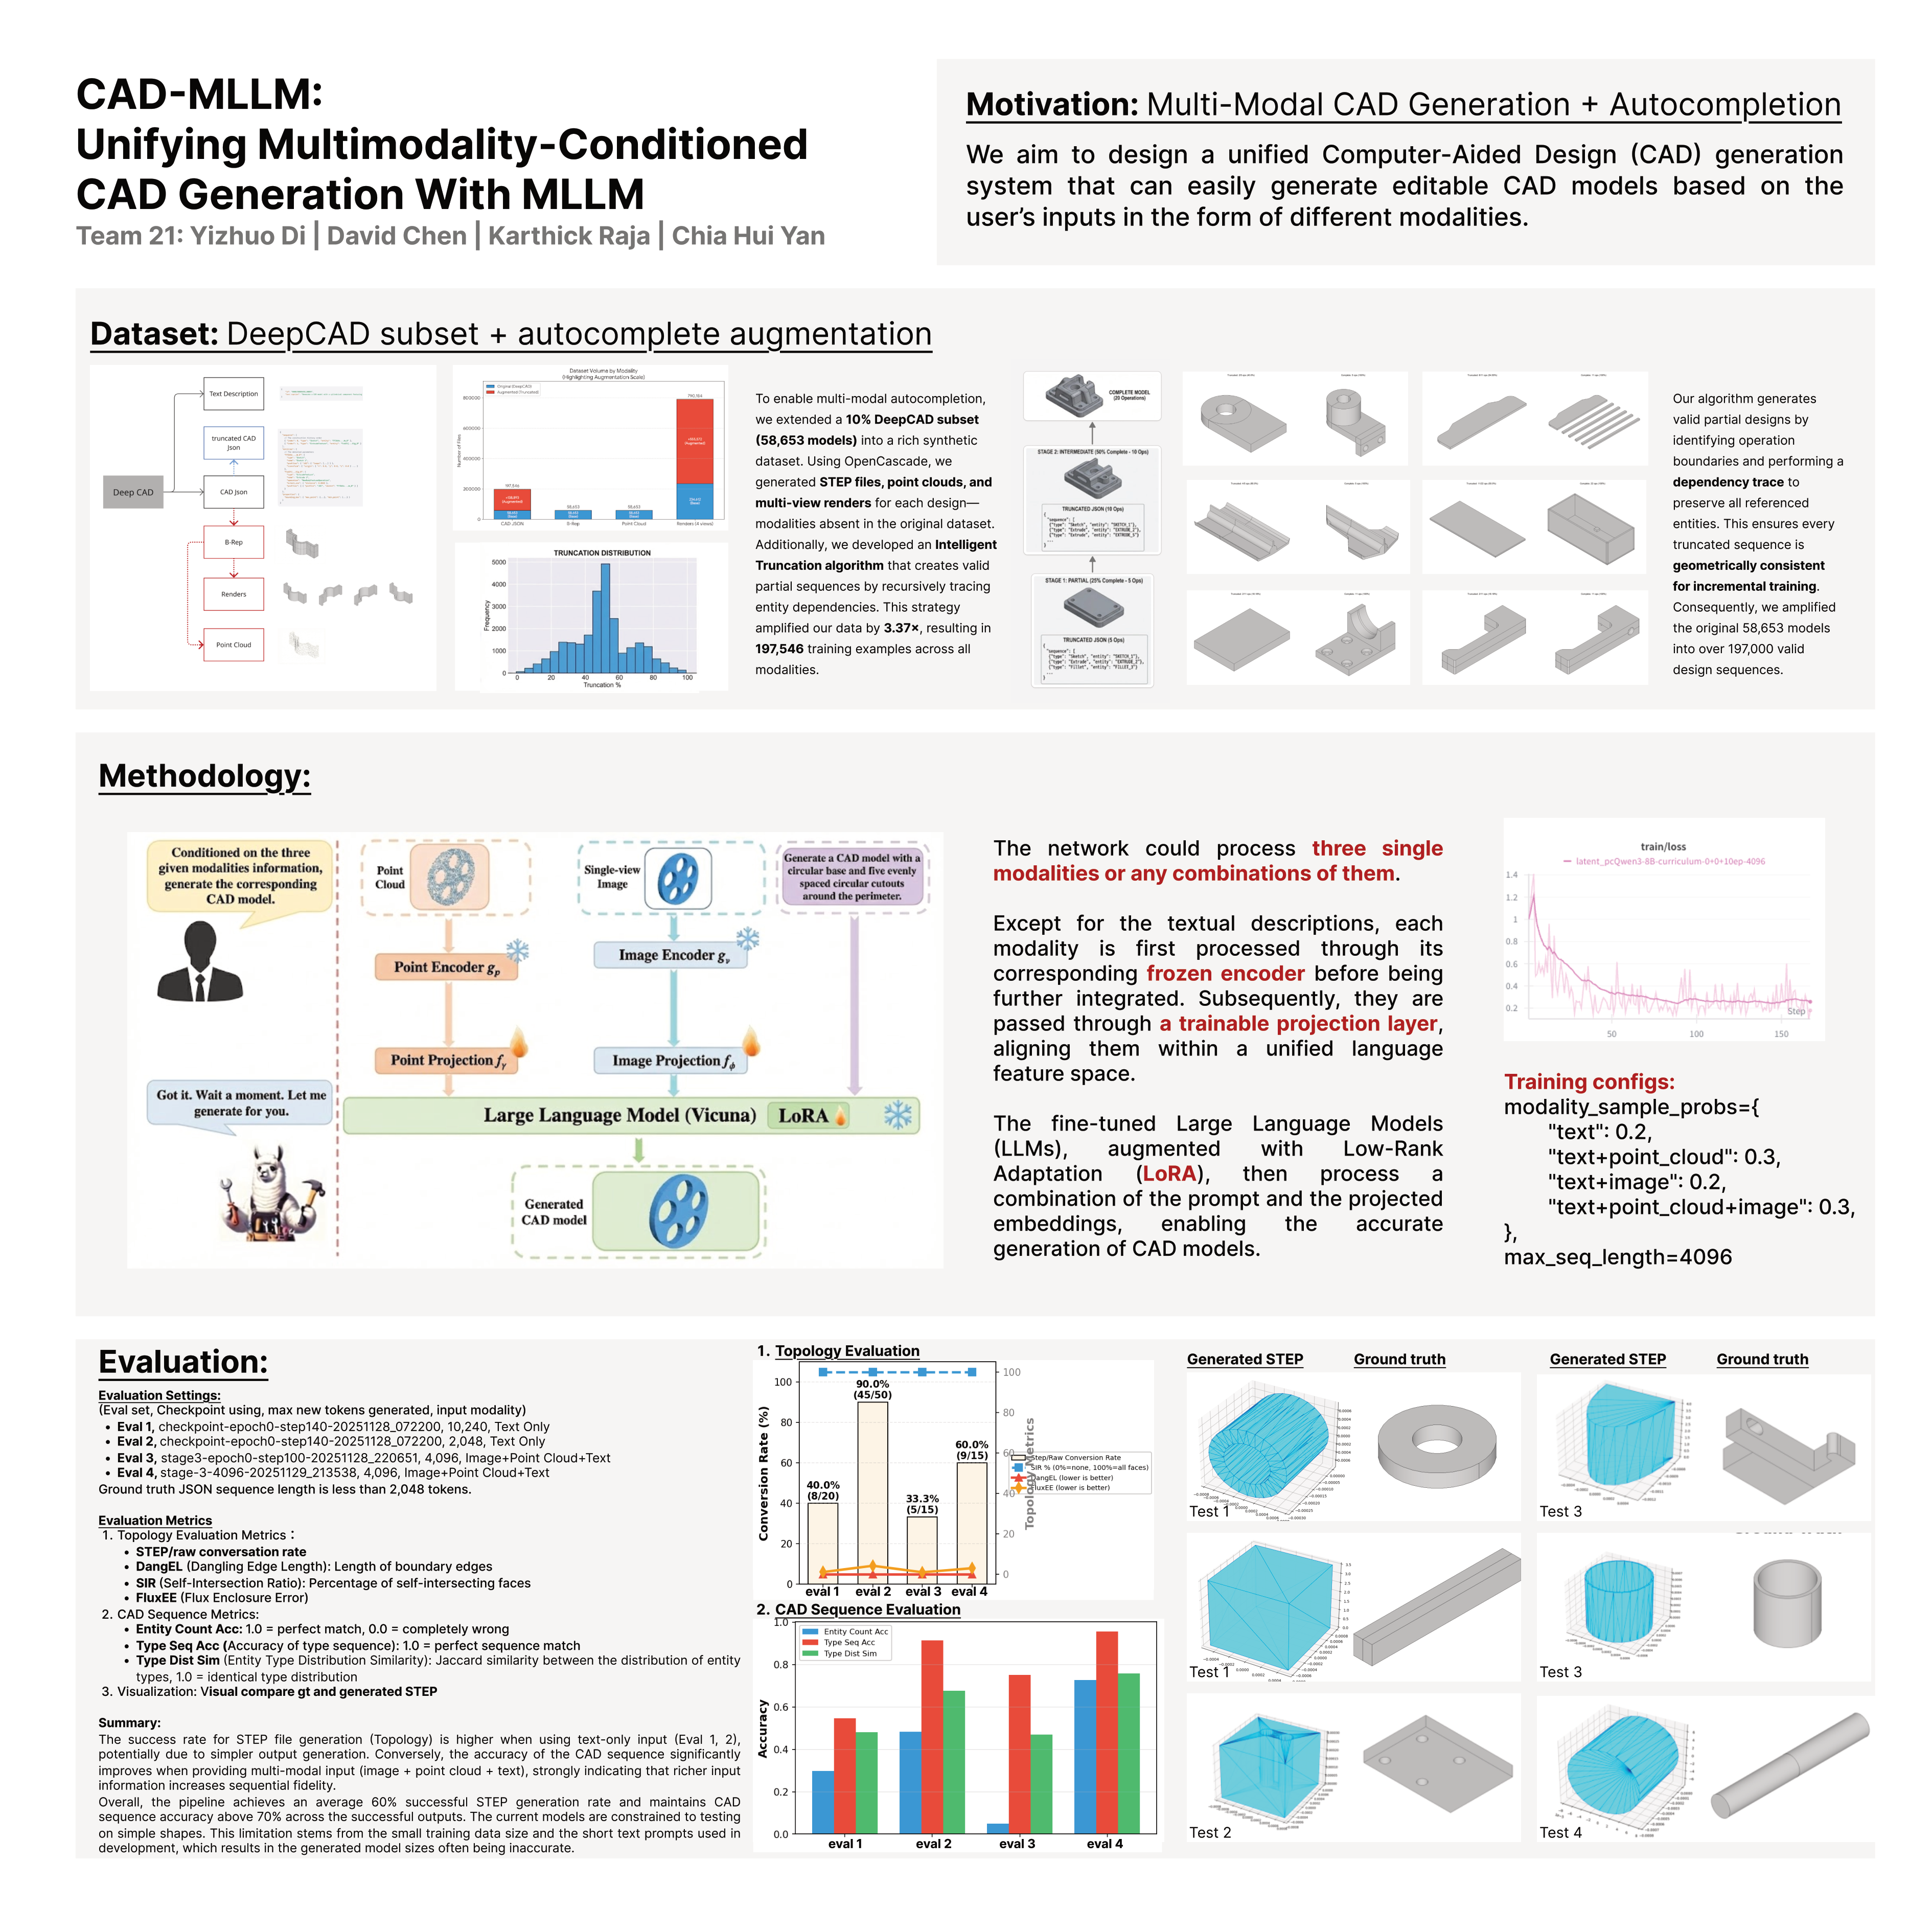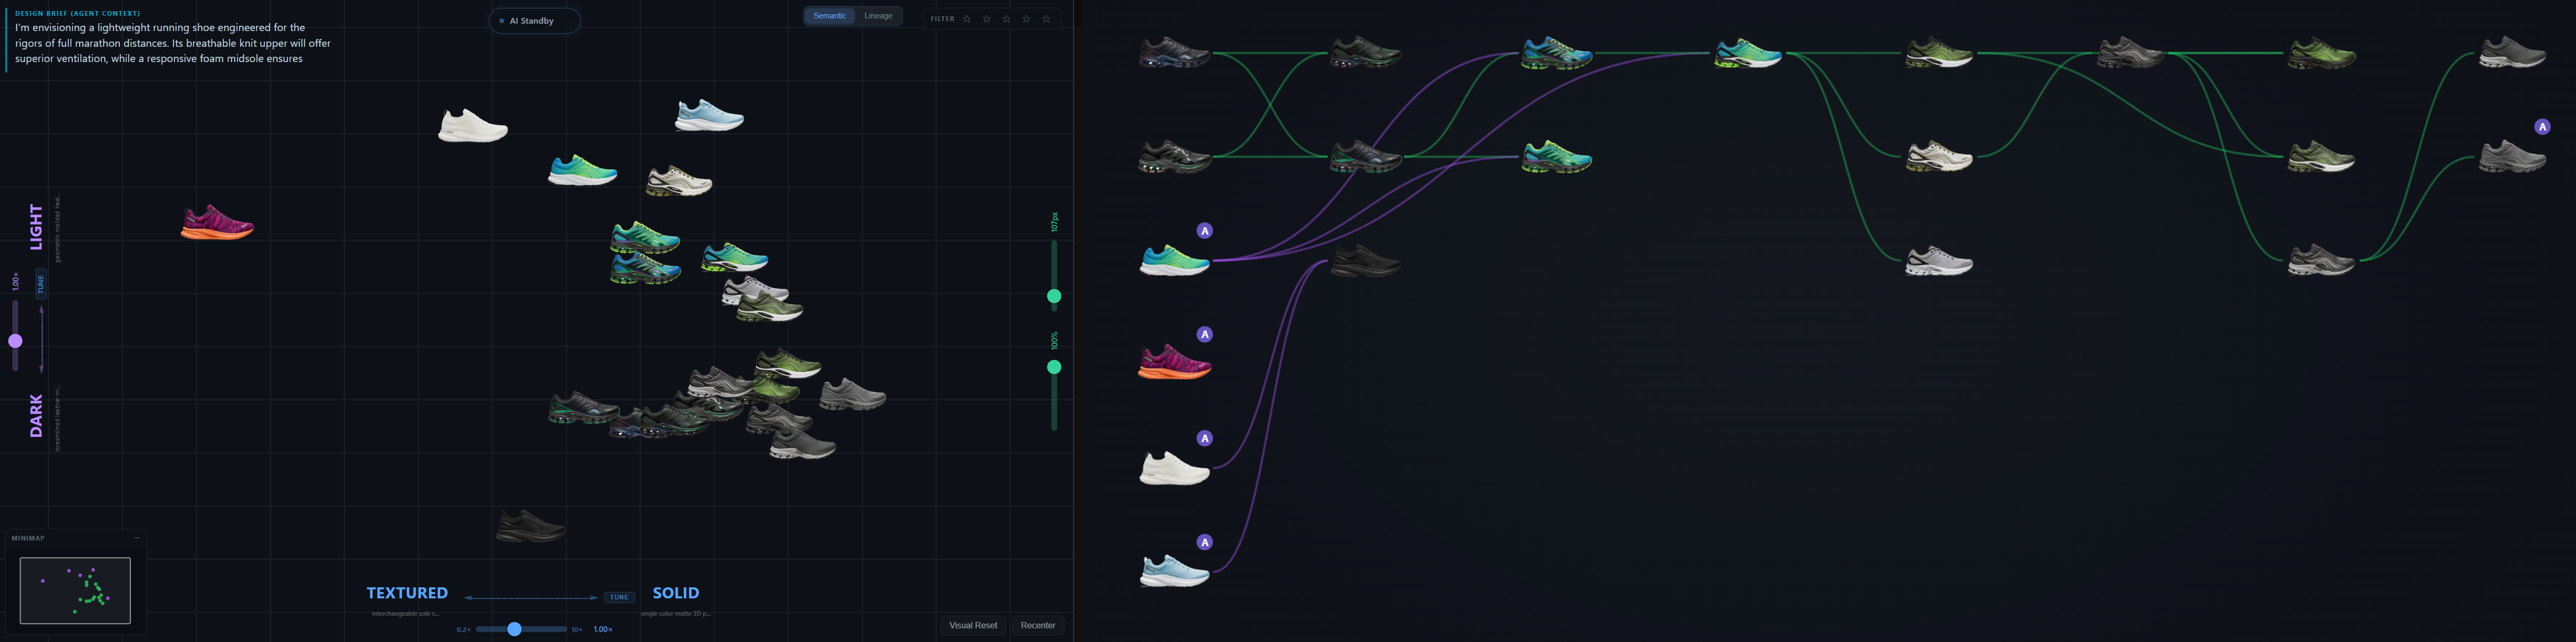
Semantic Canvas
An AI-augmented design canvas where designers navigate semantic latent spaces to generate, refine, and reason about footwear concepts in their own words.
PROBLEM
Generative models make design exploration externally addressable for the first time, but every interface so far hides the space behind a chat box: prompt in, image out, no map of where you are or what's nearby.
APPROACH
Project image embeddings onto a small number of designer-typed semantic axes via a single dot-product against ensemble label vectors. No learned mapping, no dimensionality reduction. Adding a new axis is free.
CONTRIBUTION
A latent-space instrument that externalizes the designer's mental categories so they can be inspected, argued with, and shared. Validated through a multi-participant study running through Spring 2026.
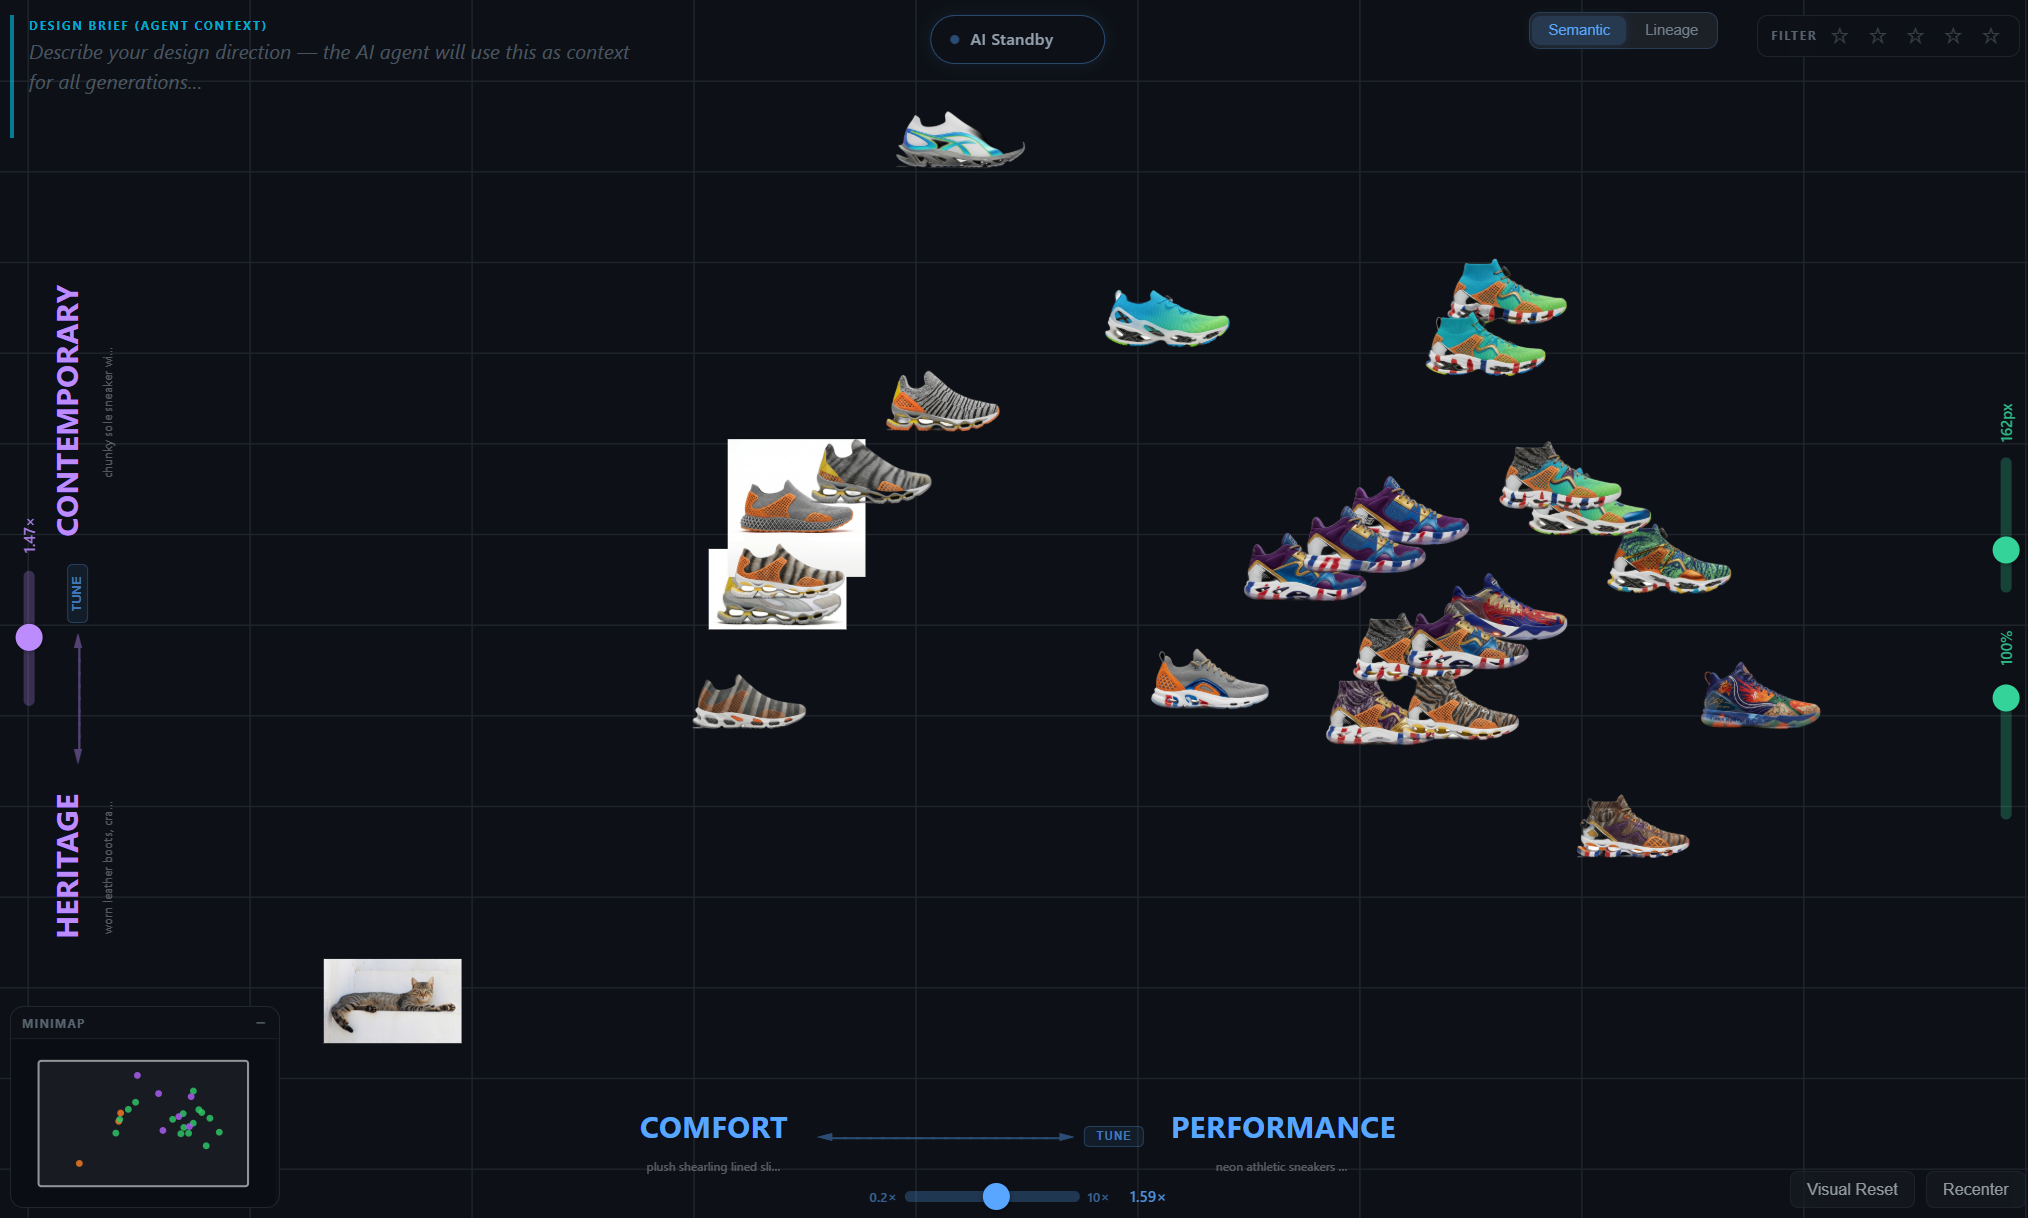
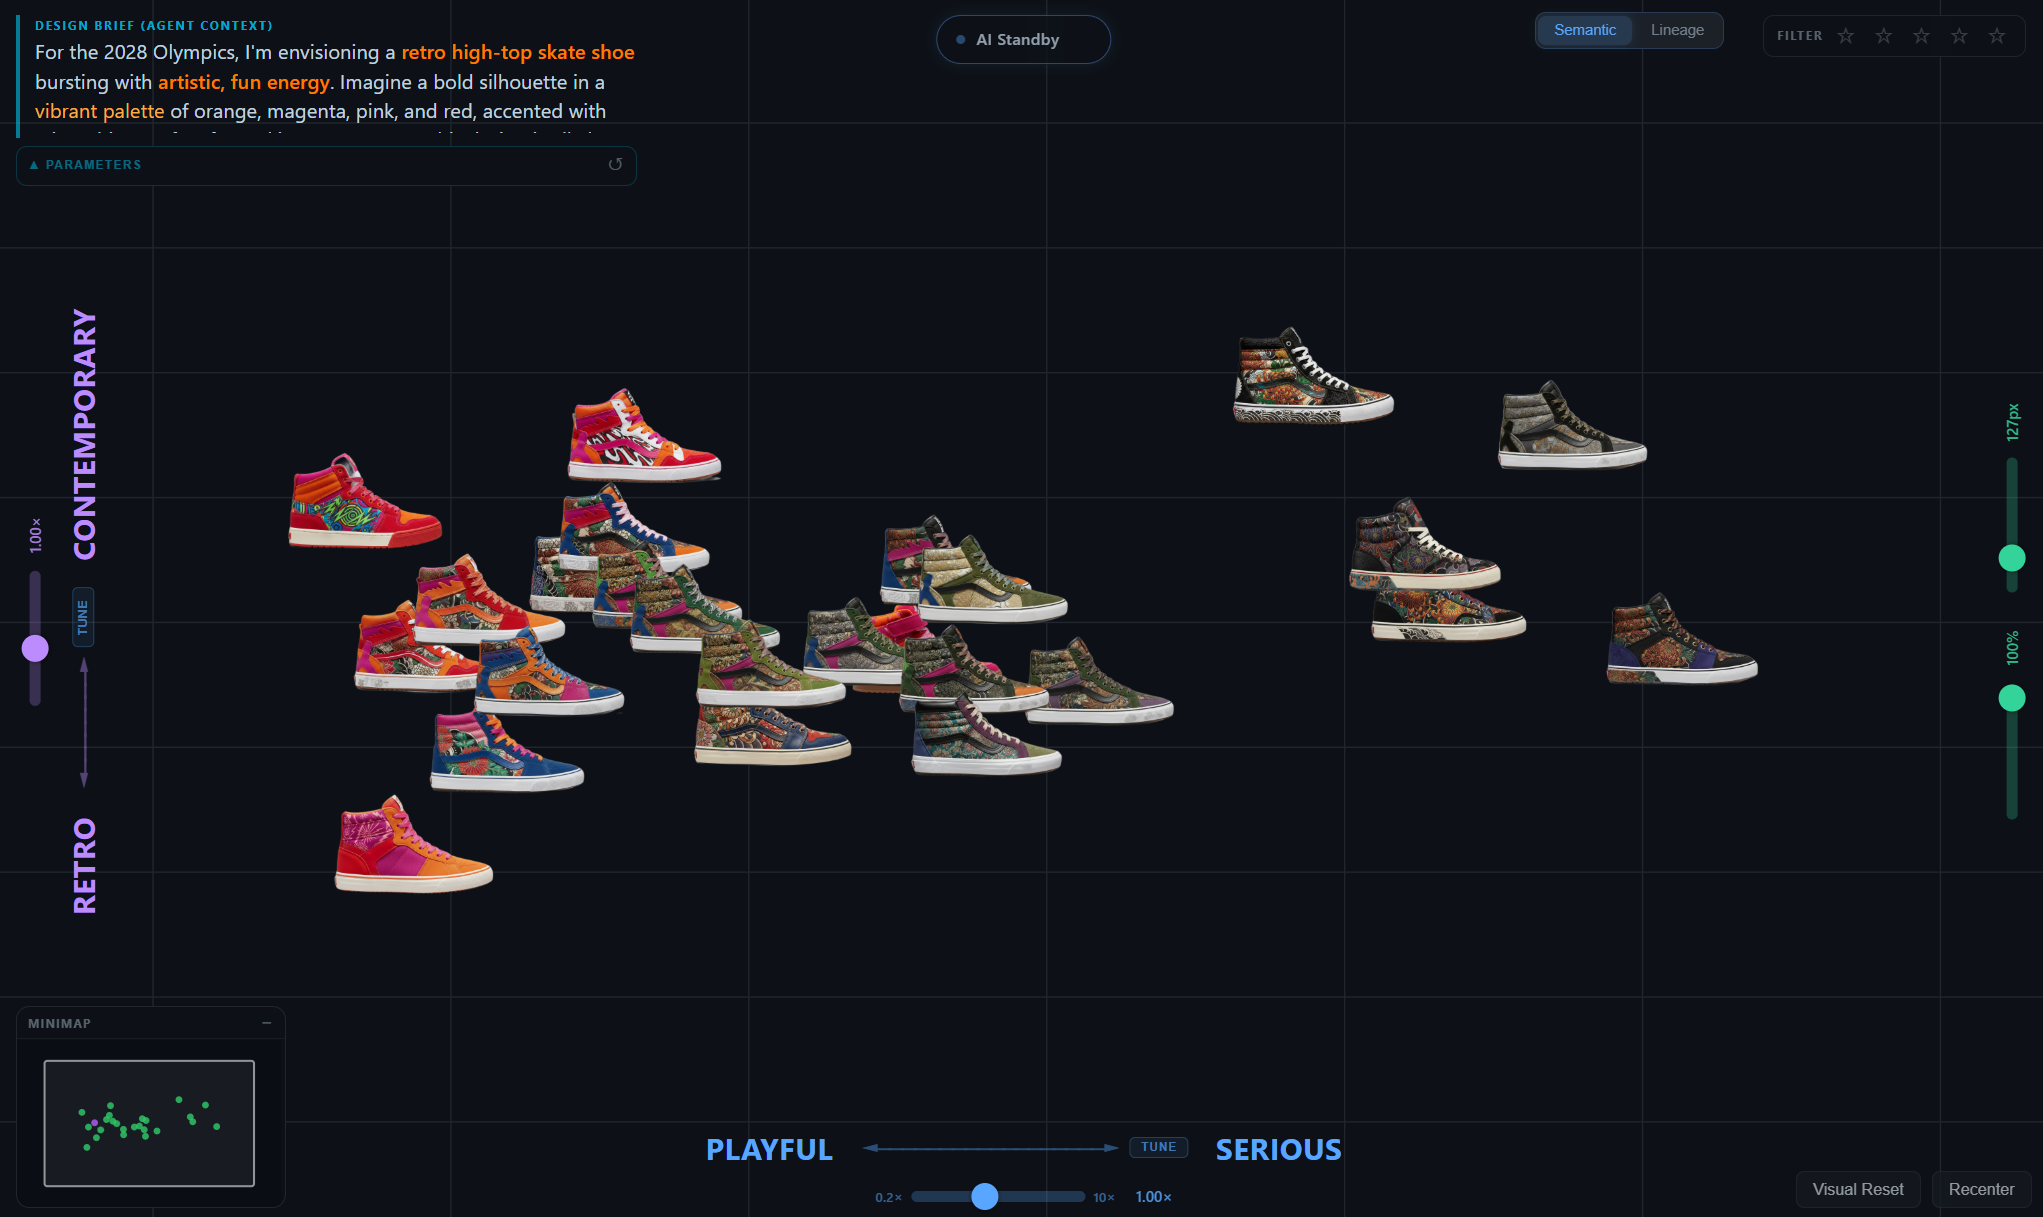
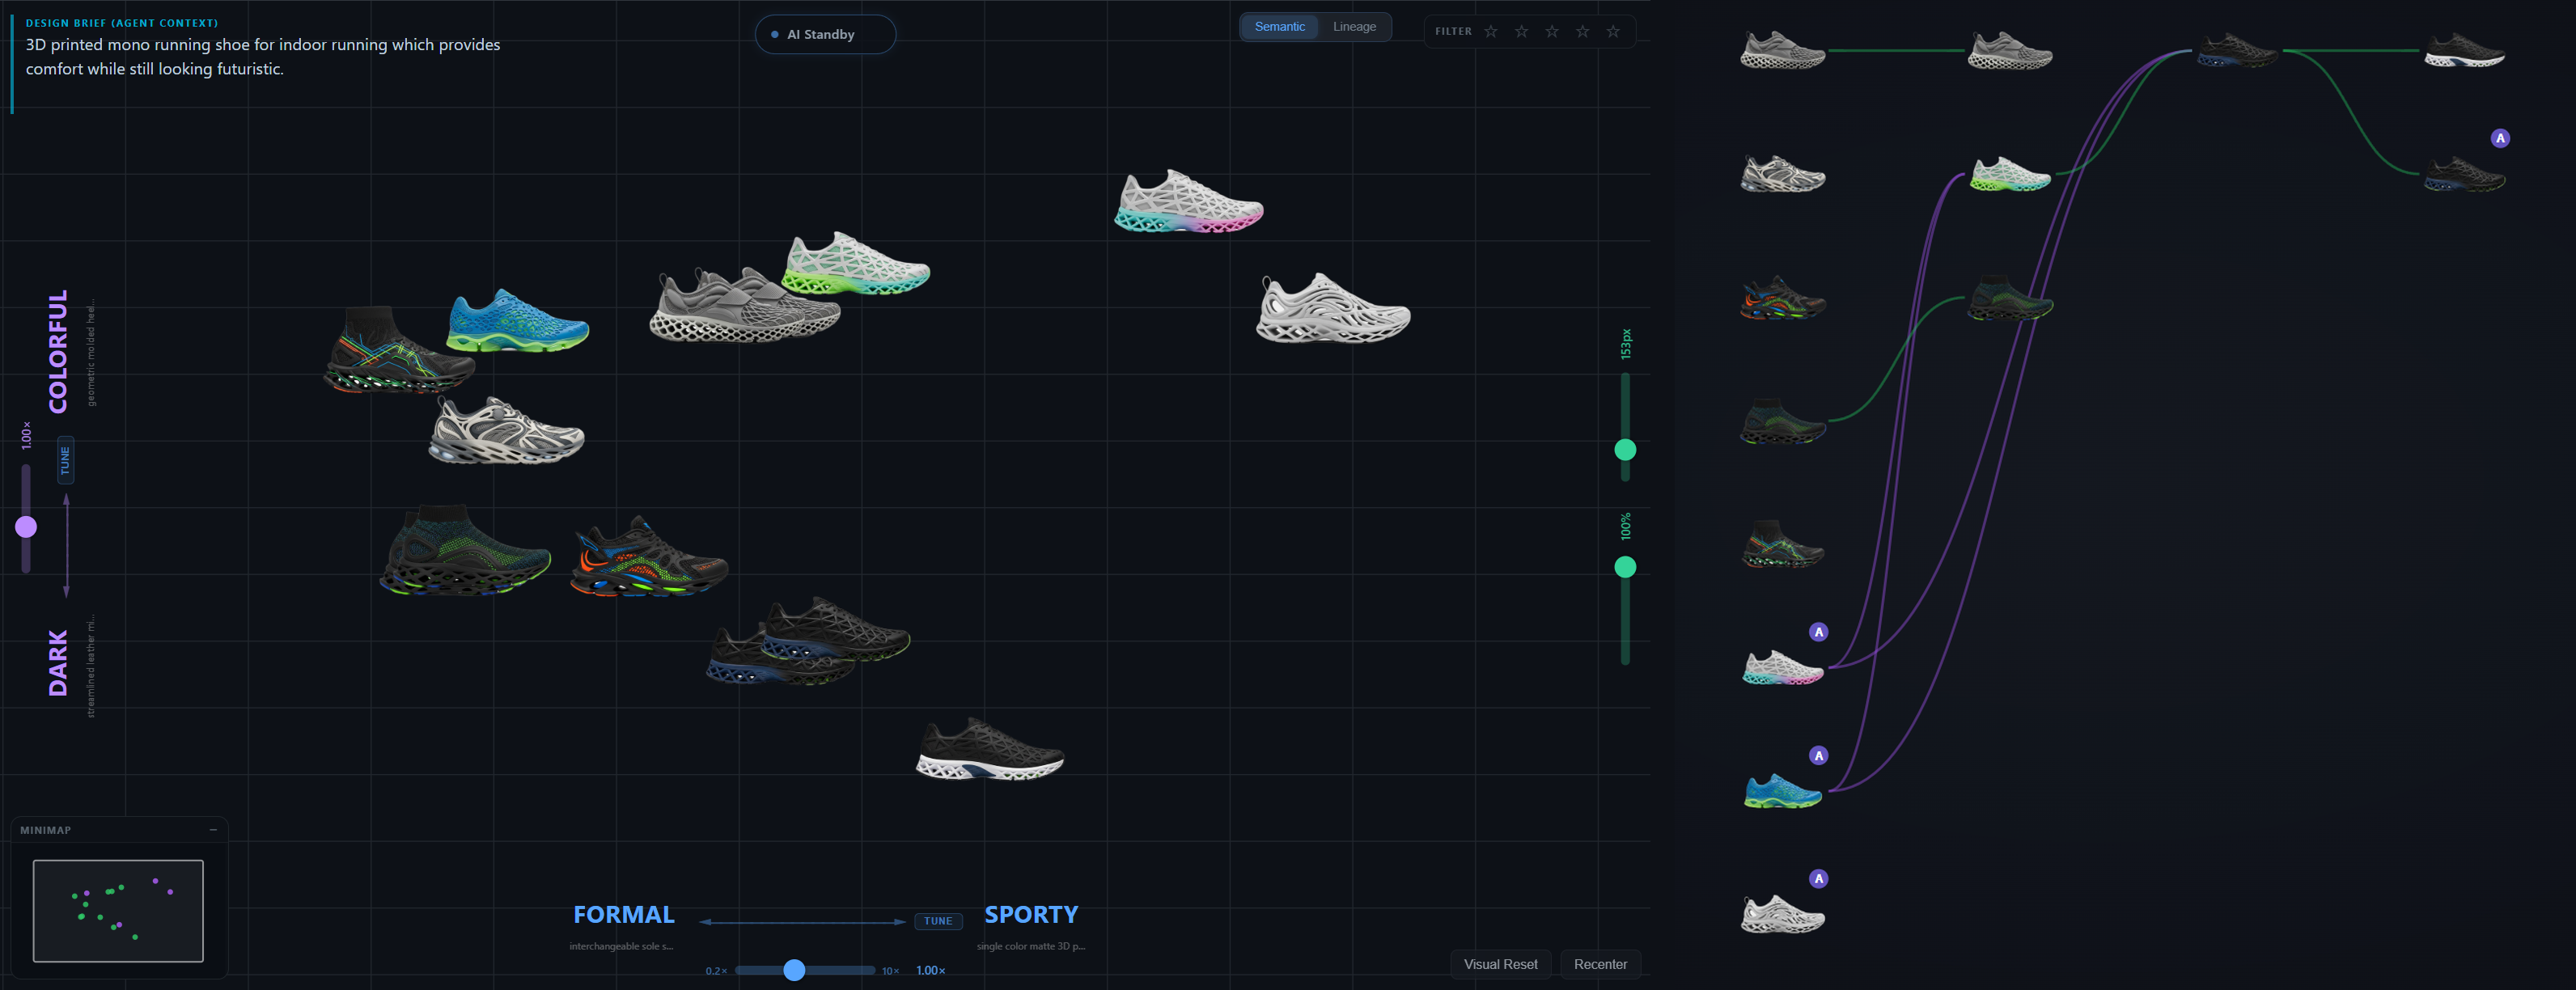
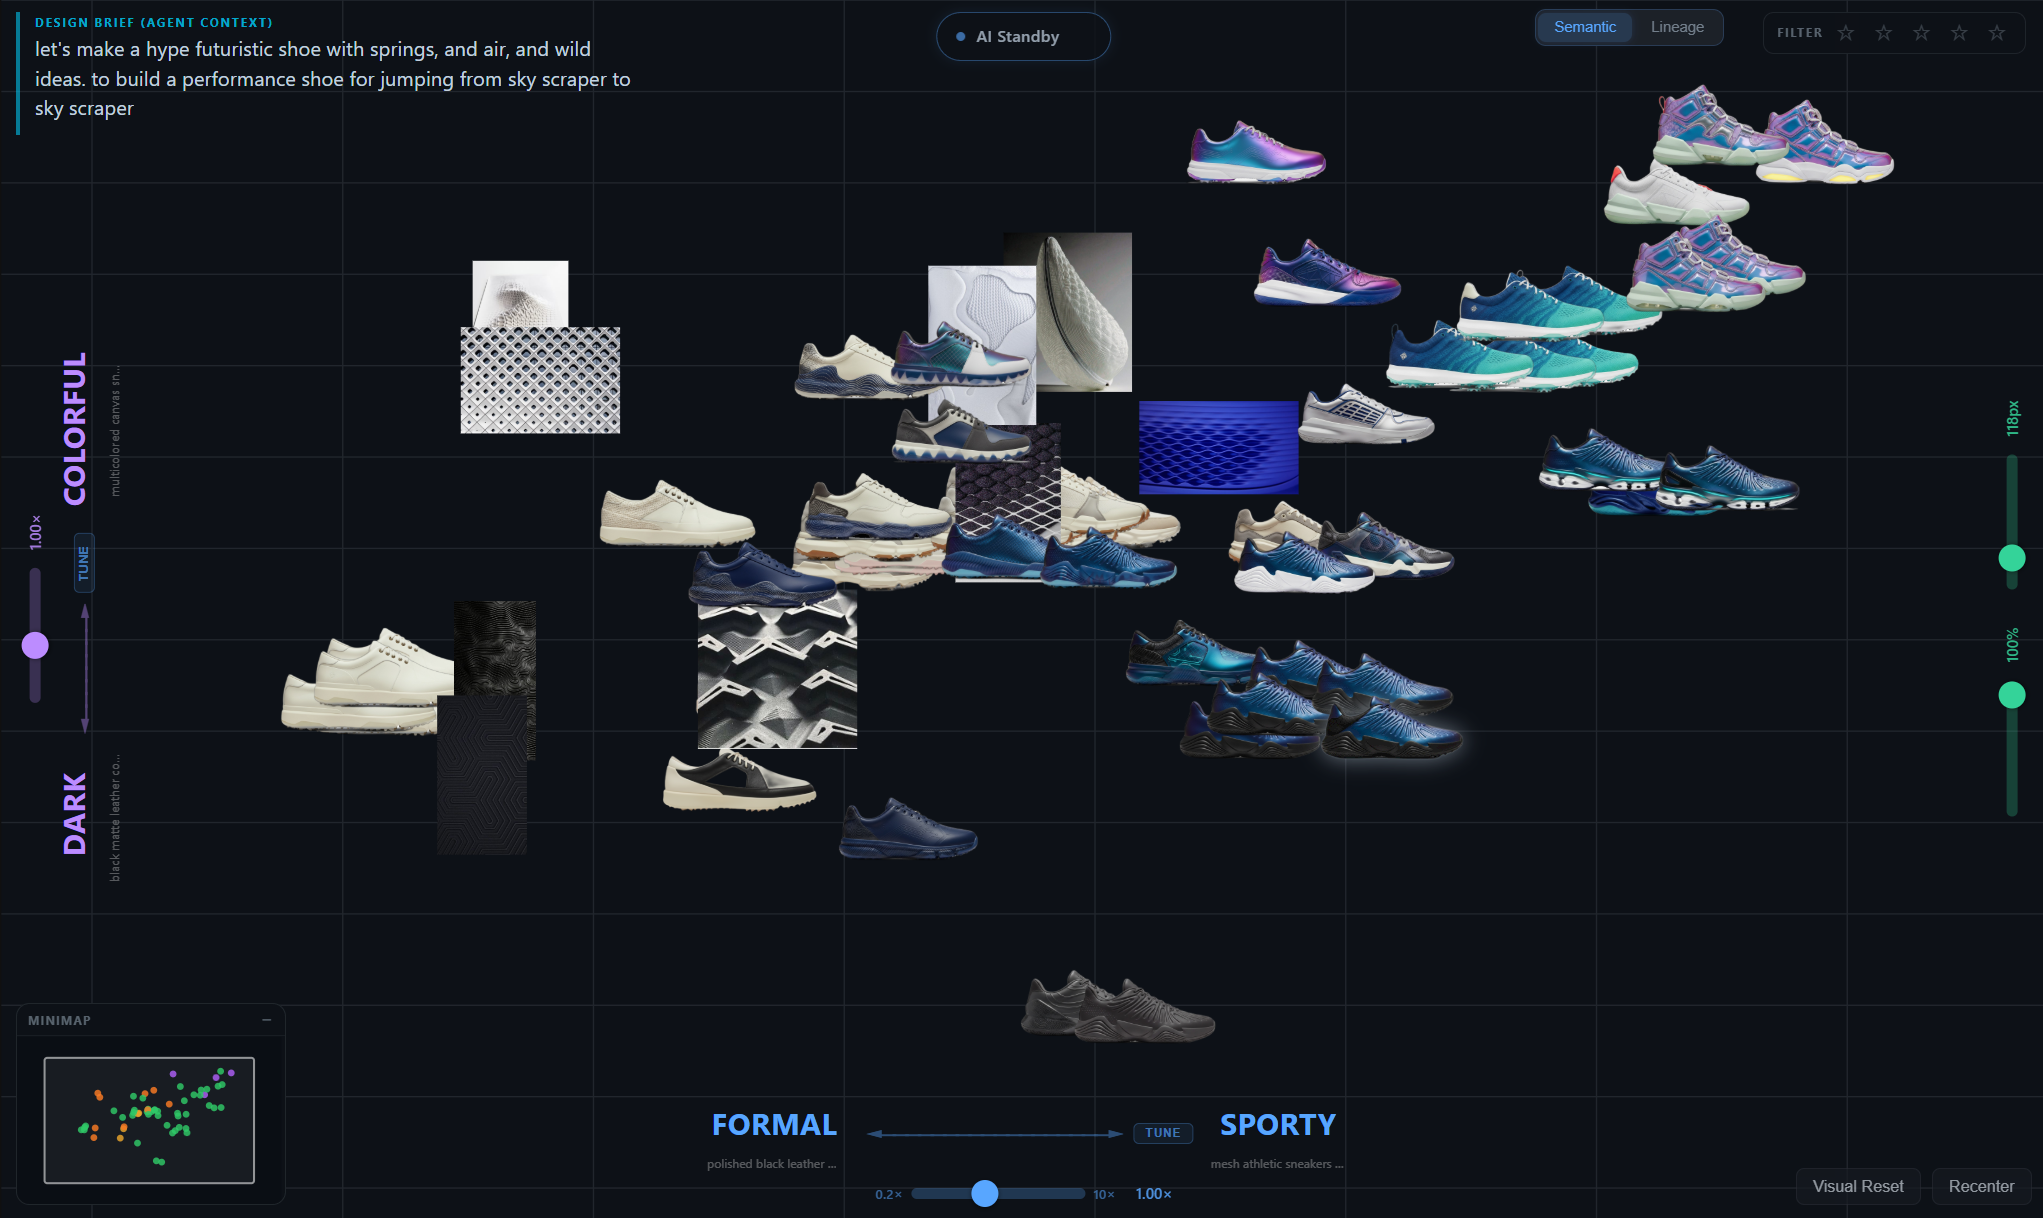
The canvas interface
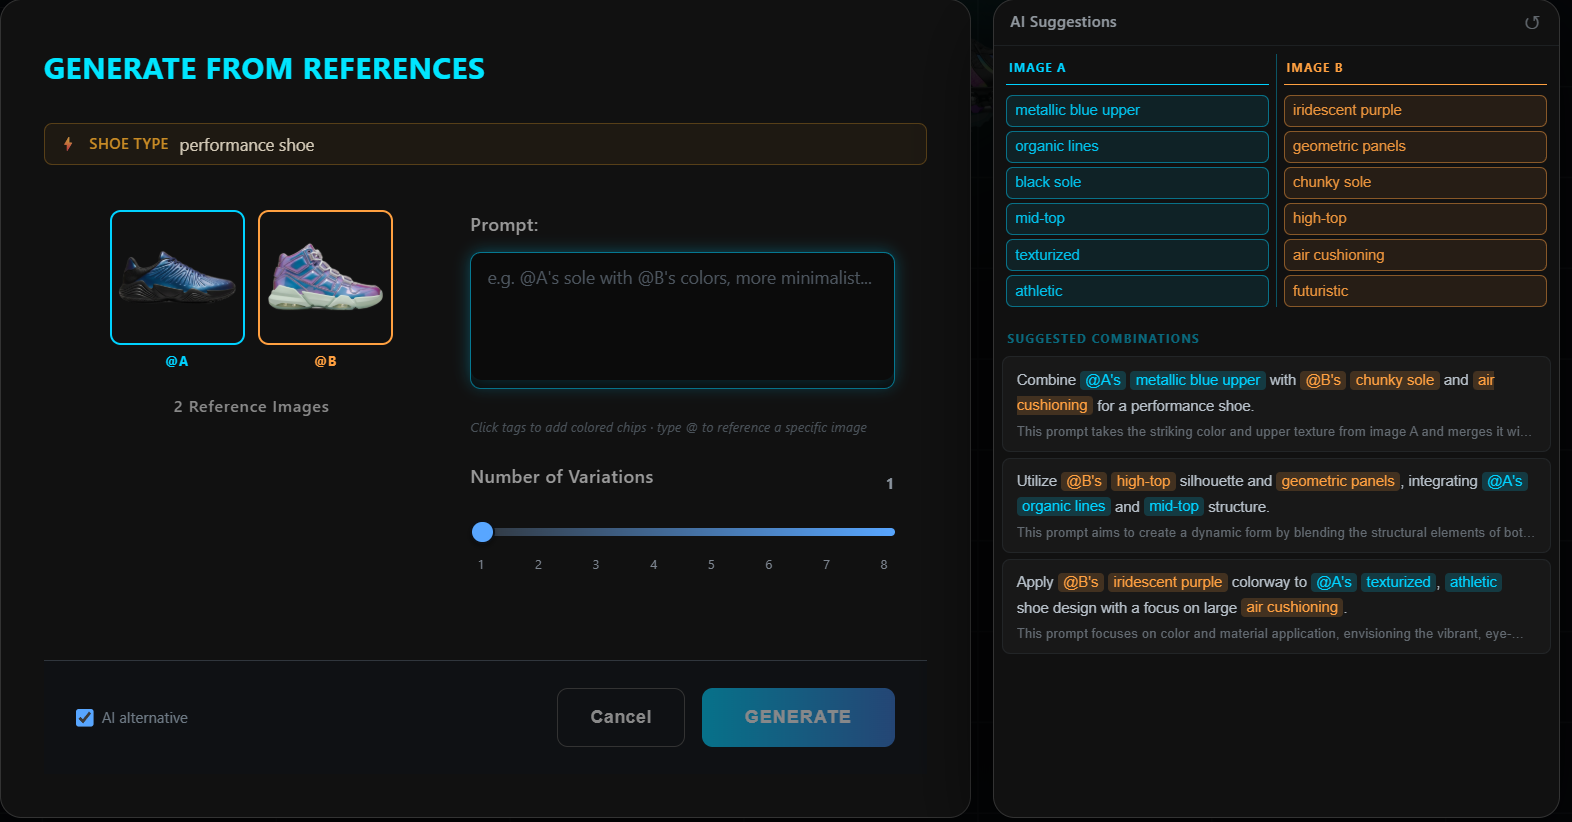
The frontend is React 18 + TypeScript + D3.js 7, with Zustand for global state. The canvas occupies the centre; a four-flyout left toolbar holds Generate, Files, AI Actions, and Axes panels; a right inspector accordion stacks Selection, Genealogy, and Actions. A bottom drawer keeps the current generation batch live as chips. Built for a designer at a 27" display, not a phone.
Latent space, made navigable
Design exploration is fundamentally about moving through a space of possibilities. Until recently that space lived only in the designer's head — implicit, ineffable, impossible to share. Generative models now make it externally addressable, but every interface so far hides the space behind a chat box. Footwear design is a useful test bed: categories are stable (silhouette, material, use-case), the visual vocabulary is shared, and a single designer iterates across hundreds of variants per project.
Semantic Canvas projects every project image onto a small number of designer-typed semantic axes (2 for the canvas, 3 for the optional 3D view). The projection is a single dot product against an ensemble axis vector built from natural-language label expansions. There is no learned mapping, no dimensionality reduction algorithm, no training step at runtime. Adding a new axis is free.
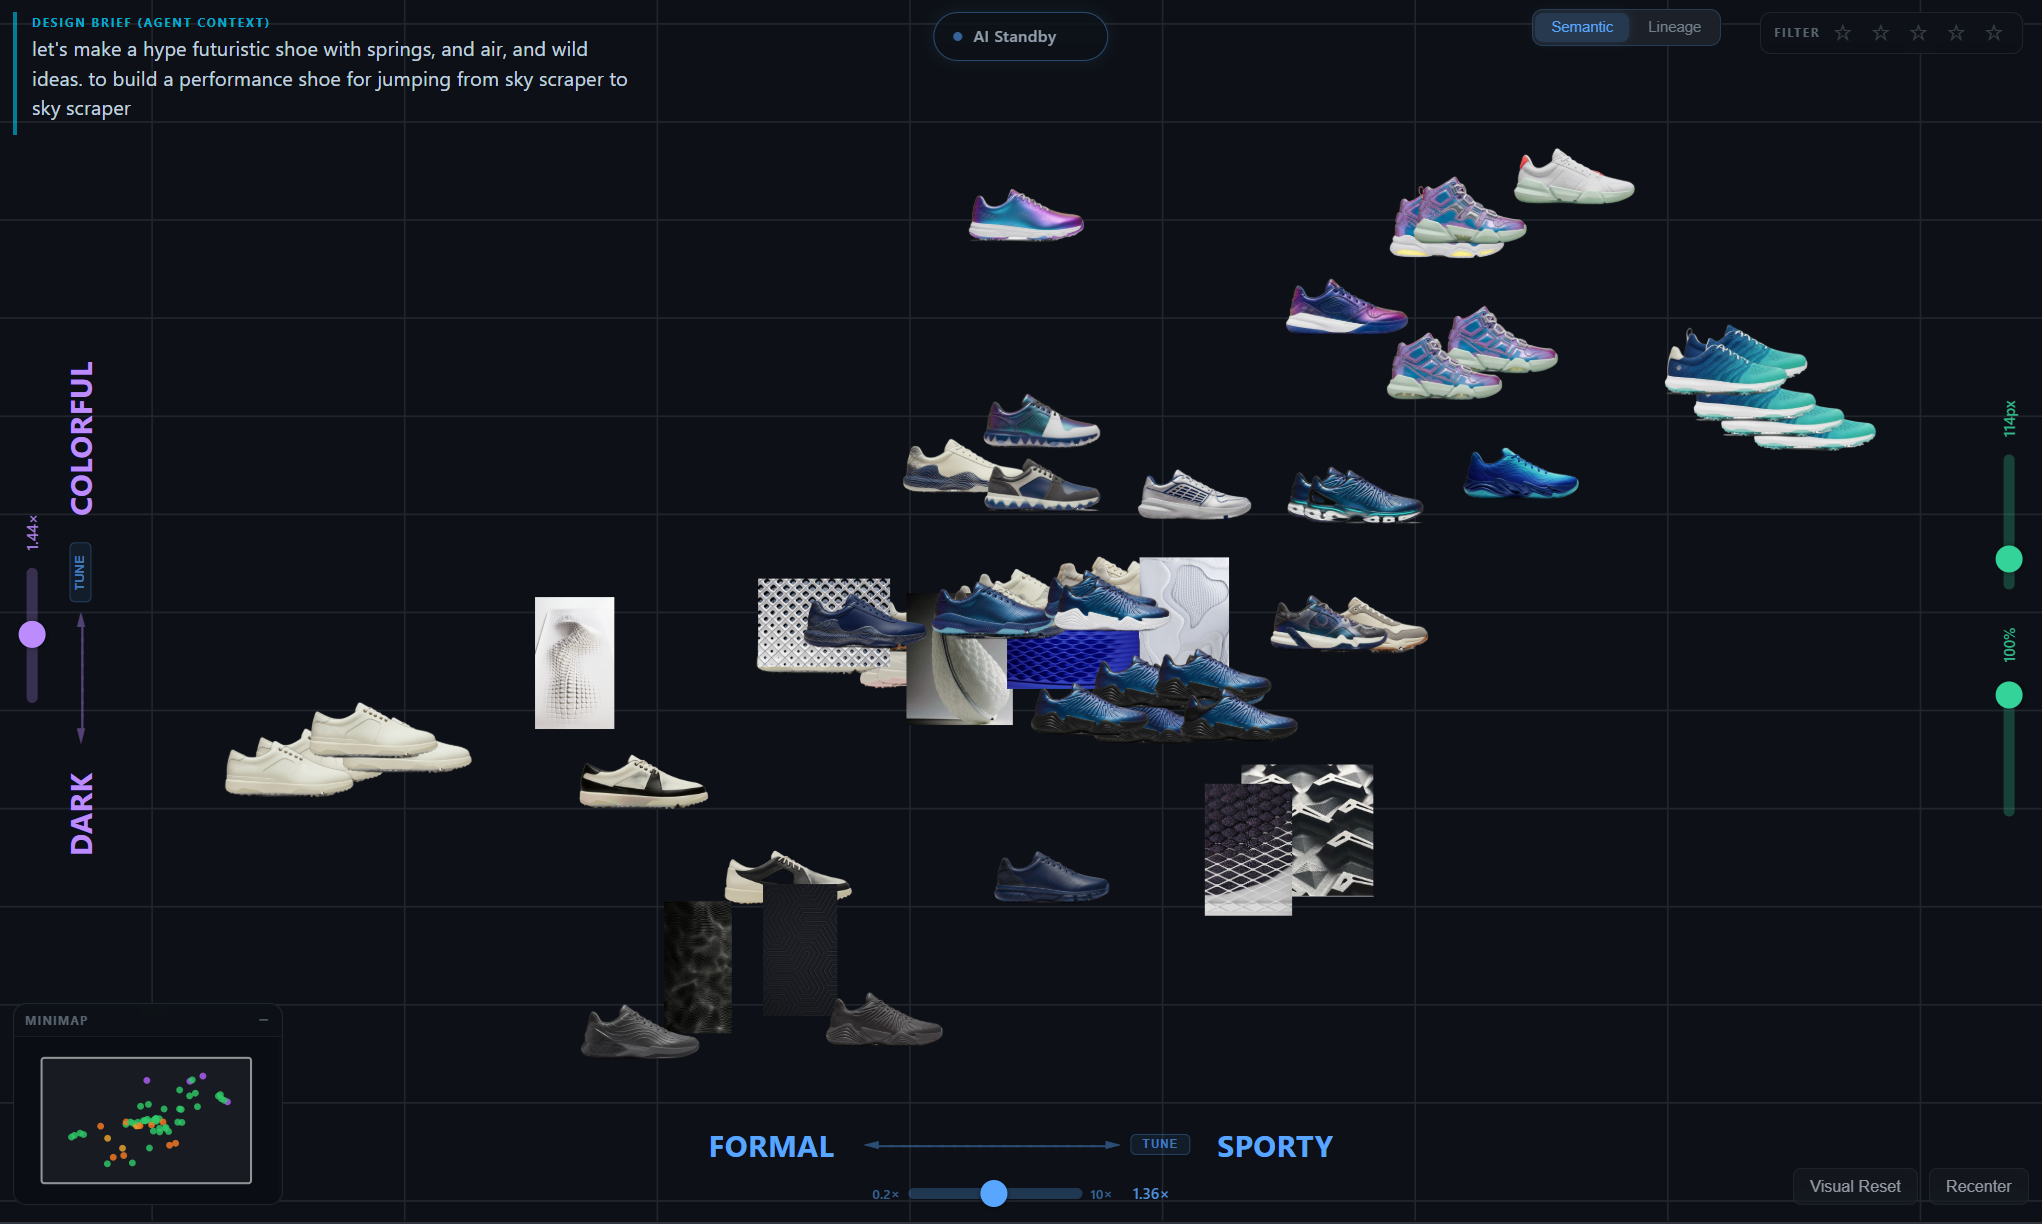
The projection formula
For each axis the user defines a positive label and a negative label (e.g. casual and formal). Gemini expands each side into 4 concrete visual descriptions — sneakers, athleisure, skate; oxford, derby, monk strap. We embed all 8 phrases with Jina CLIP v2, mean-pool each side, and L2-normalize the difference. Because axis vector and image vector live in the same 1024-dimensional space, the dot product is a meaningful similarity score.
Why dot-product, not UMAP or t-SNE
The standard answer for "show me a 2D map of high-dimensional data" is dimensionality reduction. They produce beautiful clusters, but each axis is a mathematical artifact: principal direction of variance, manifold neighborhood preservation, crowding-penalty optimum. A designer cannot say what an axis means — only that points near each other look similar.
For a design tool that fails. The whole point is to externalize the designer's mental categories so they can be inspected, argued with, and shared with collaborators. If the tool can't tell you what up means on its own canvas, it isn't a tool — it's a decoration.
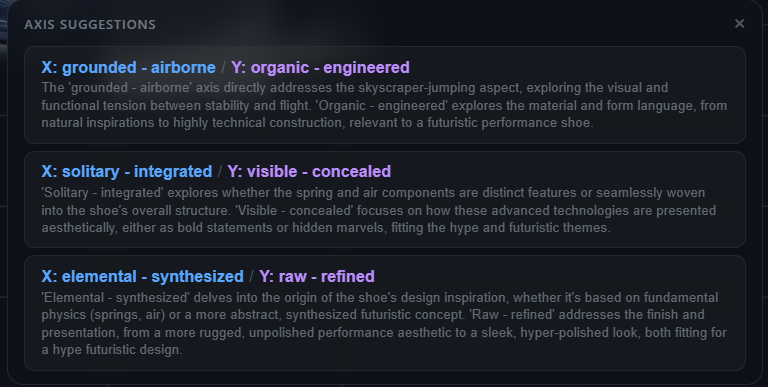
Tuning by image anchors
Pure text axes are a strong starting point, but designers often want to say "more like this shoe, less like that one" — exemplar reasoning. Tune mode lets the user drag image anchors to either pole of an axis. The axis direction is replaced with a weighted blend: the original text direction plus the L2-normalized difference of mean-pooled anchor image embeddings, with a user-controllable mix. The result is still a single 1024-D unit vector; everything downstream is unchanged.
The Gemini observer
Gemini 2.5 Flash Lite runs as a passive observer — it reads the designer's typed brief, highlights primary goals (blue) and secondary considerations (amber), and surfaces sticky insights when canvas state suggests them. Crucially, it never interrupts. Insight timers stop the moment an insight is displayed, so unread insights cost zero further tokens. The agent is a colleague, not a chatbot.
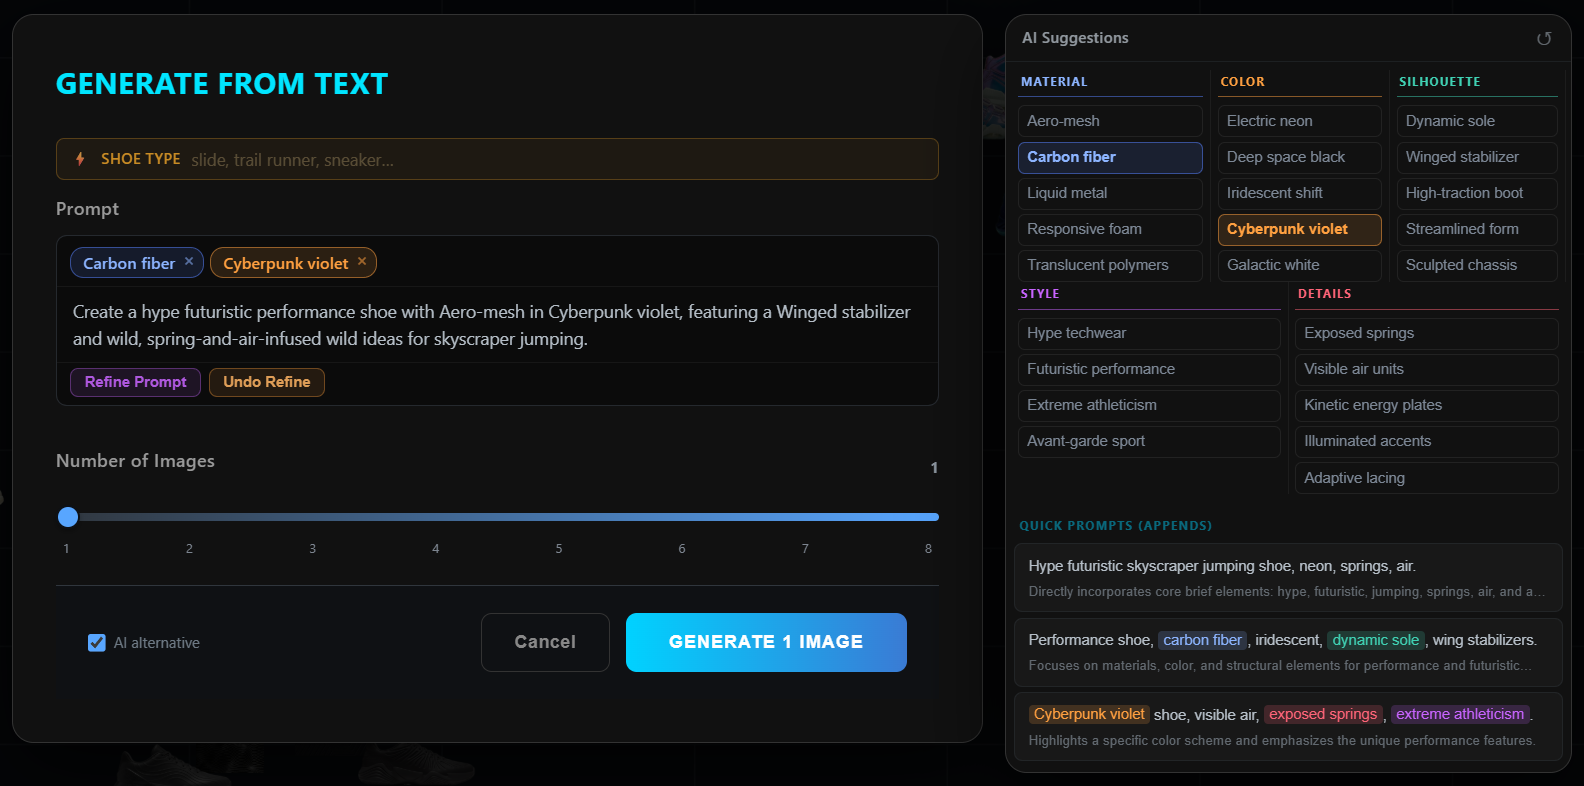
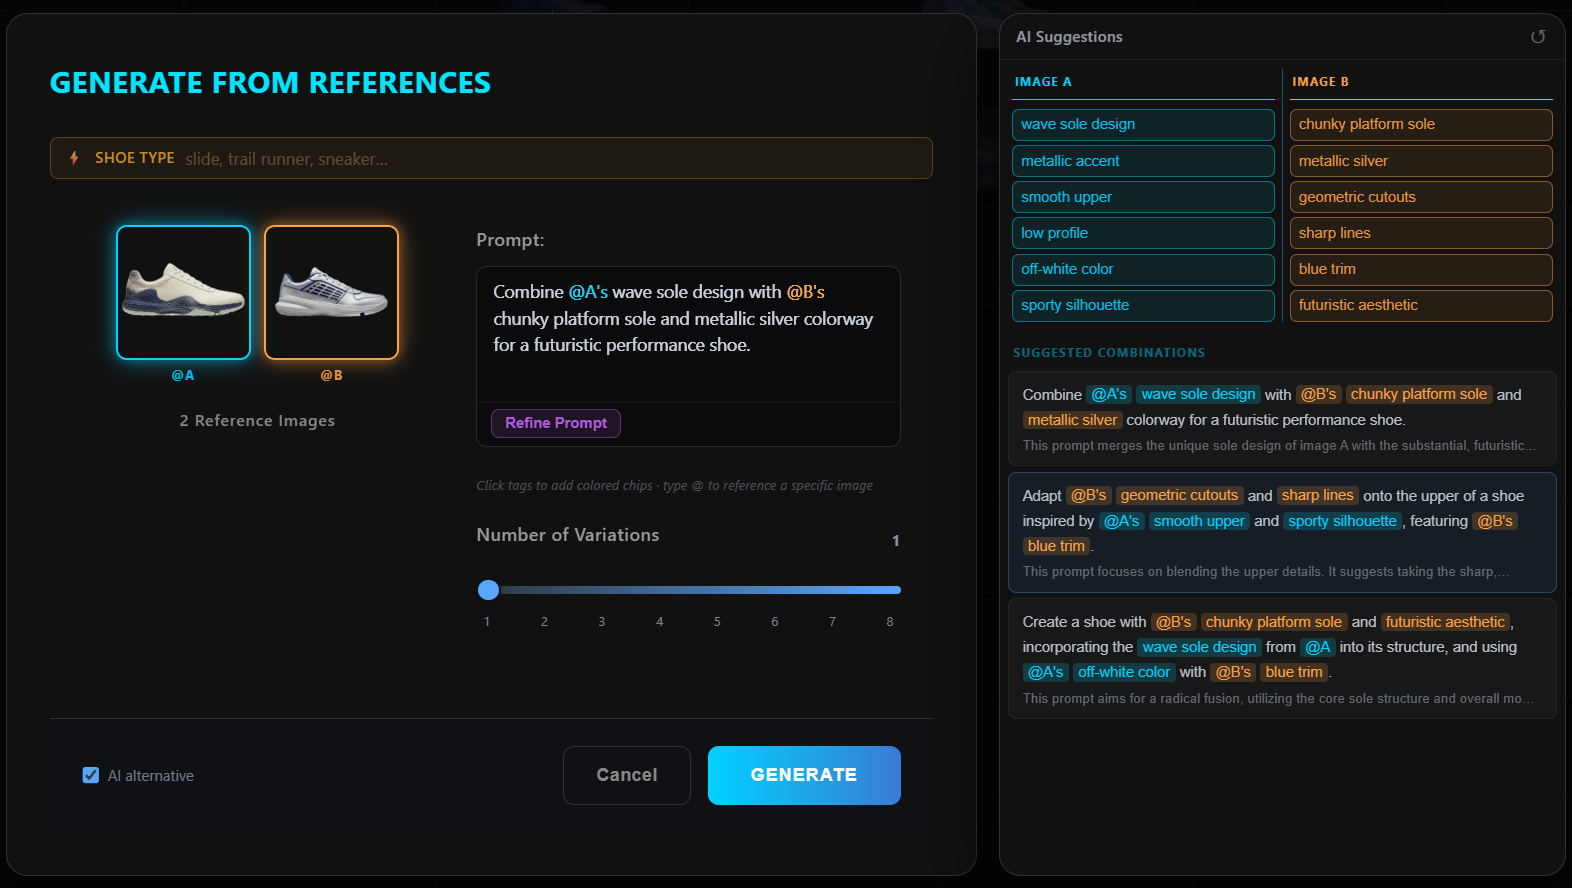
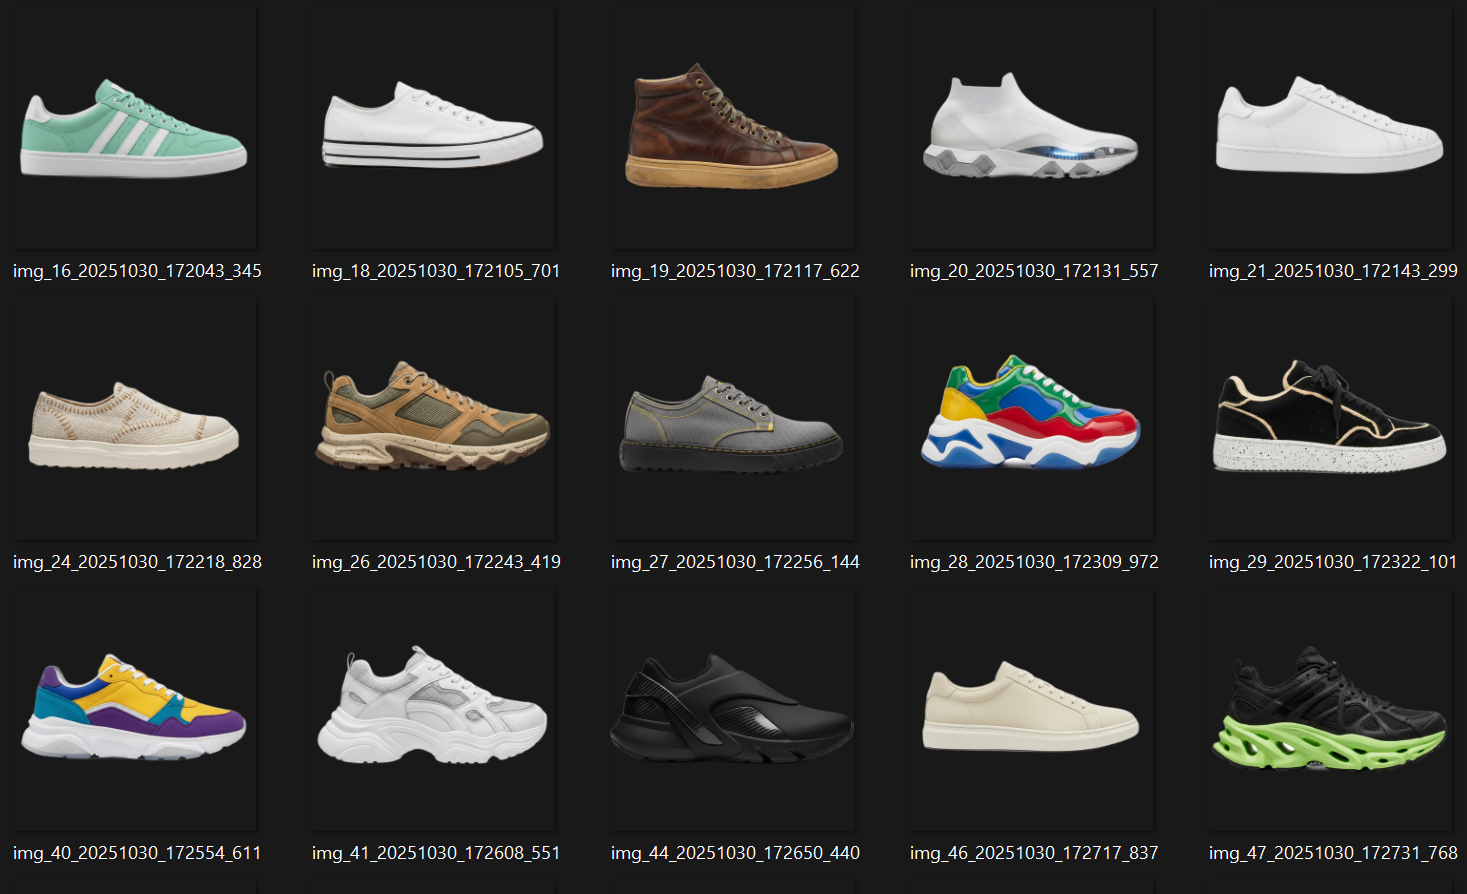
Generated footwear
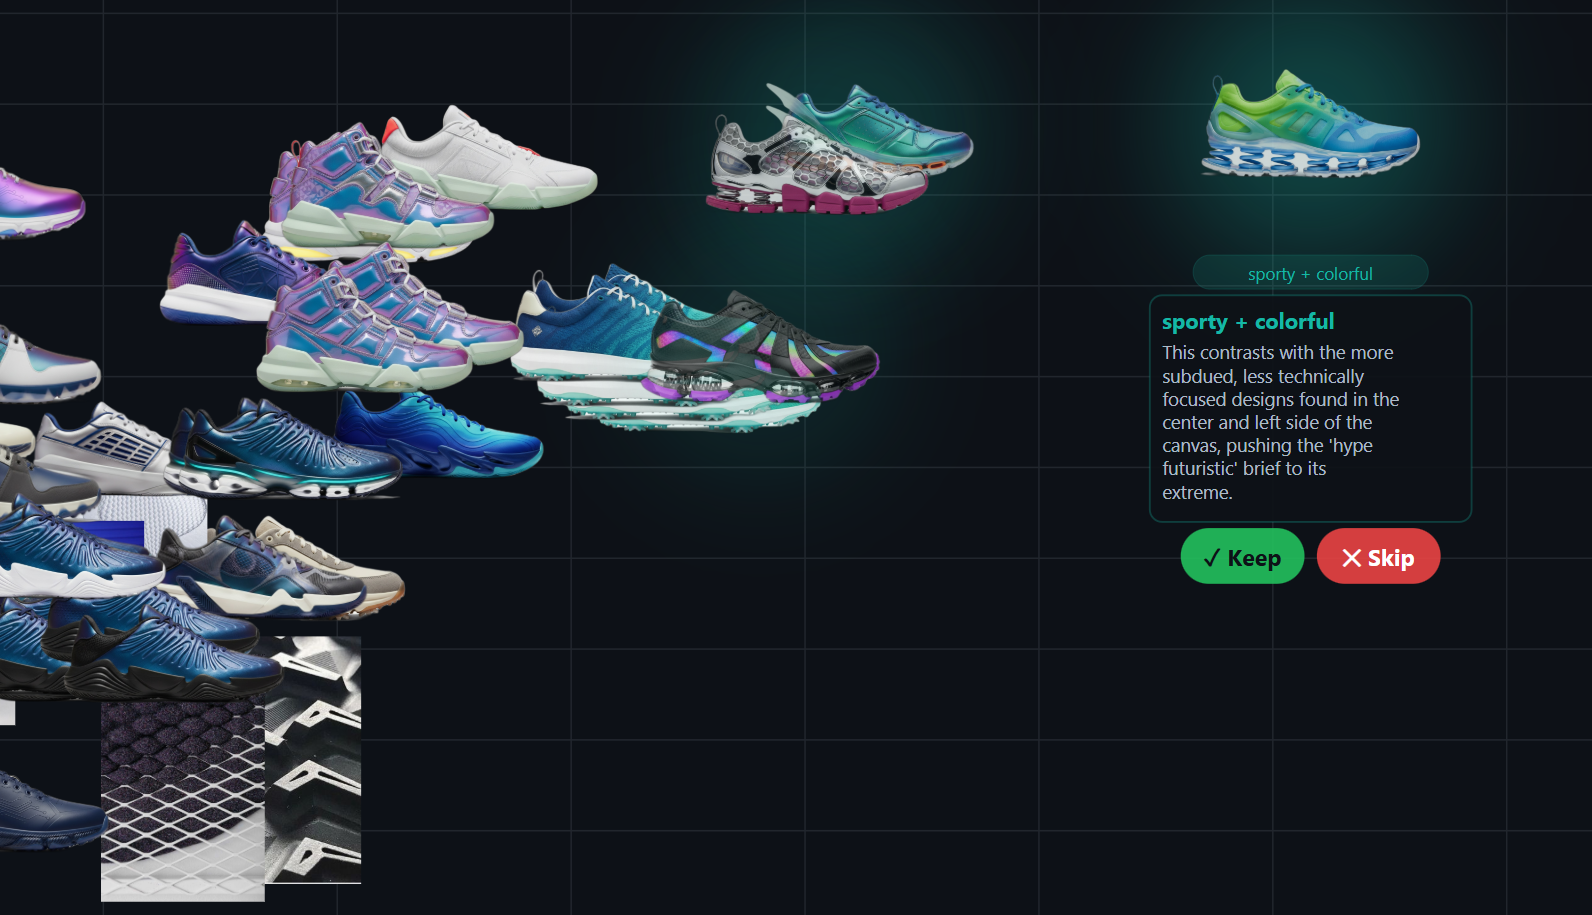
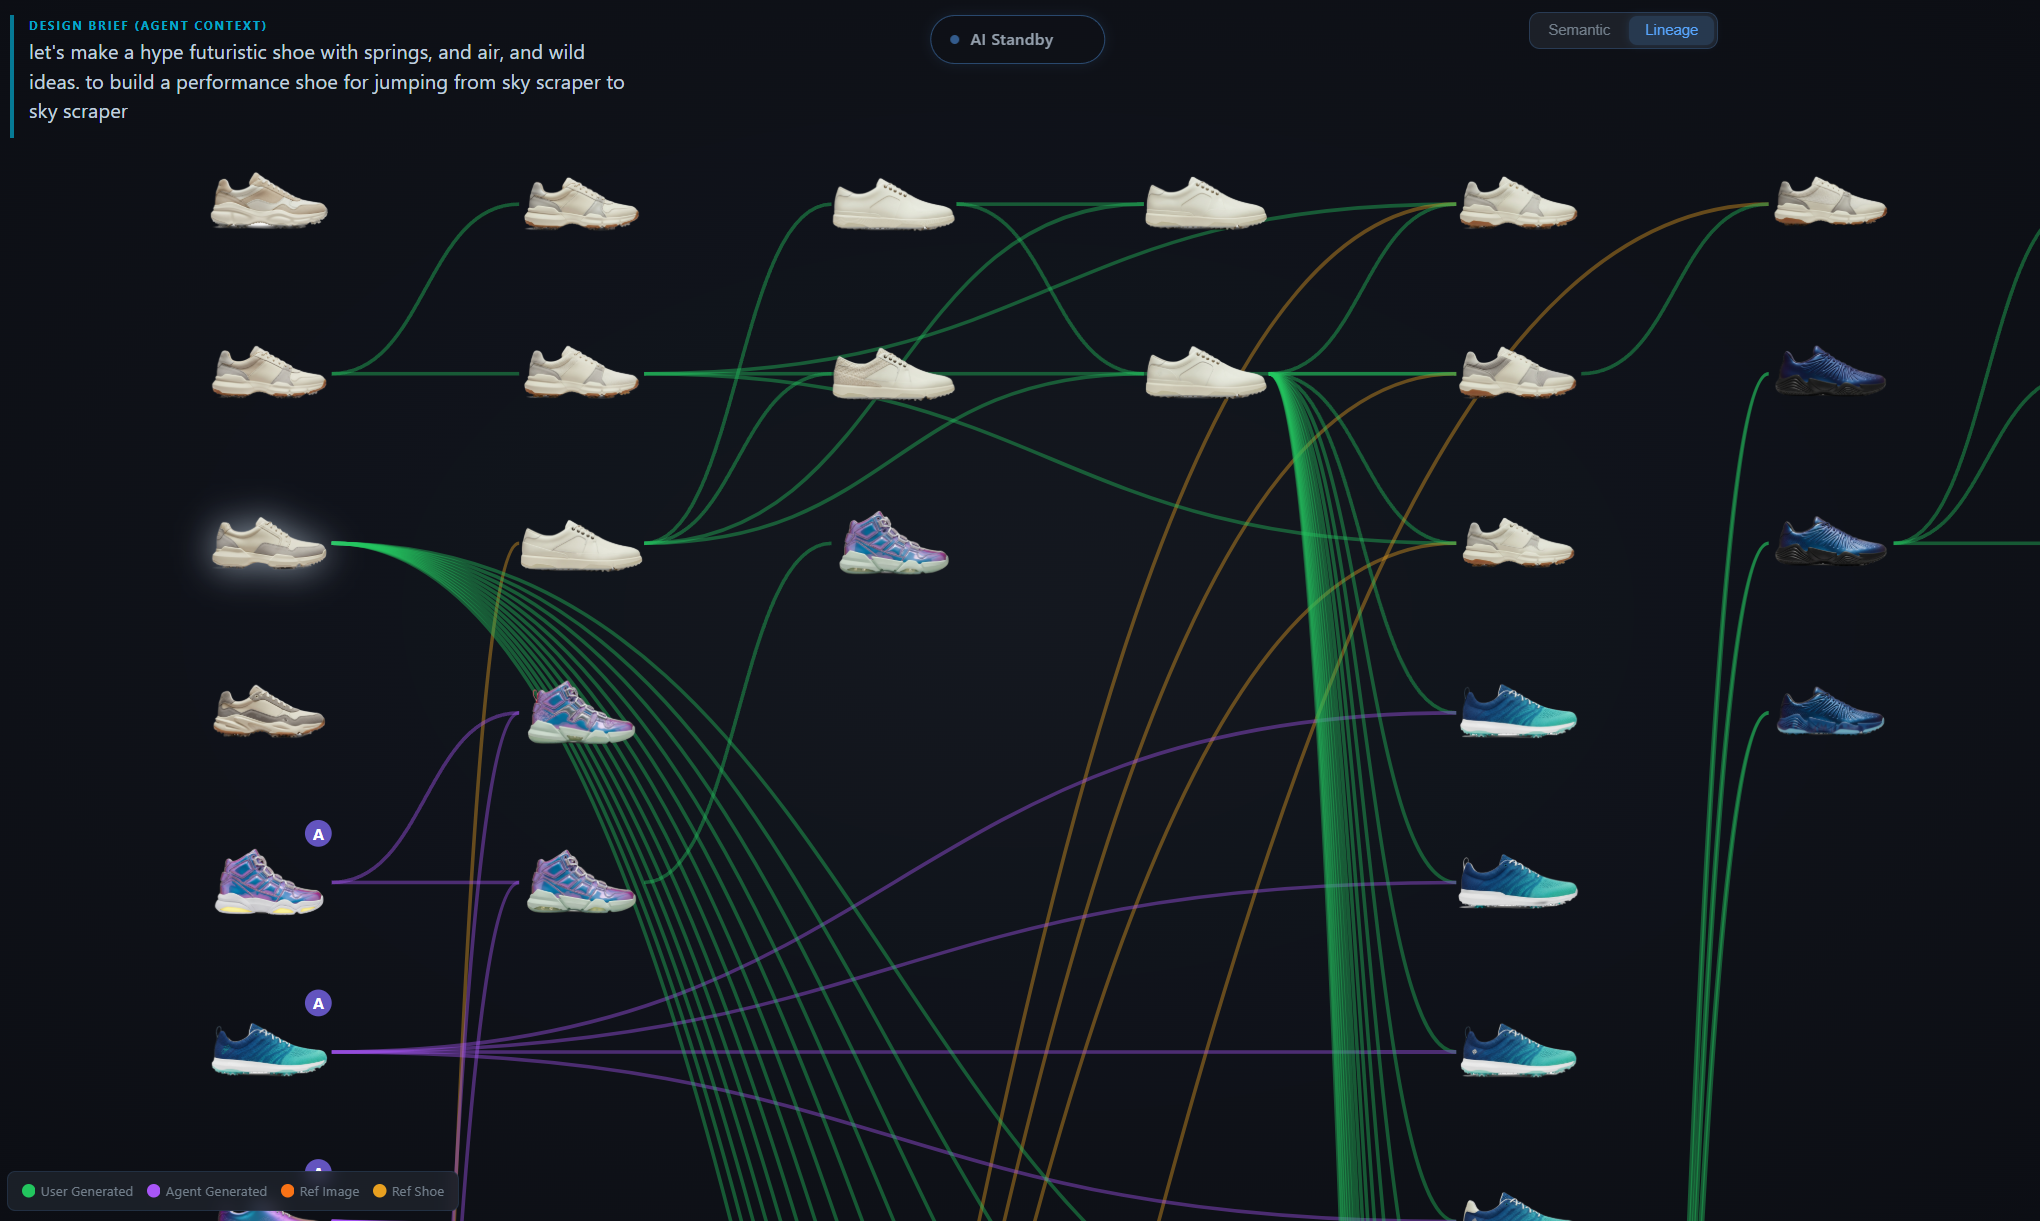
Generation is dual-mode through fal.ai — nano-banana for text-to-image and reference-based iteration, nano-banana-2 for multi-view sheets (5-view, 3/4-view, satellite views: 3/4-front, 3/4-back, top, outsole, medial, front, back). New images land back on the canvas with parent–child Bezier lineage lines connecting them to their references.
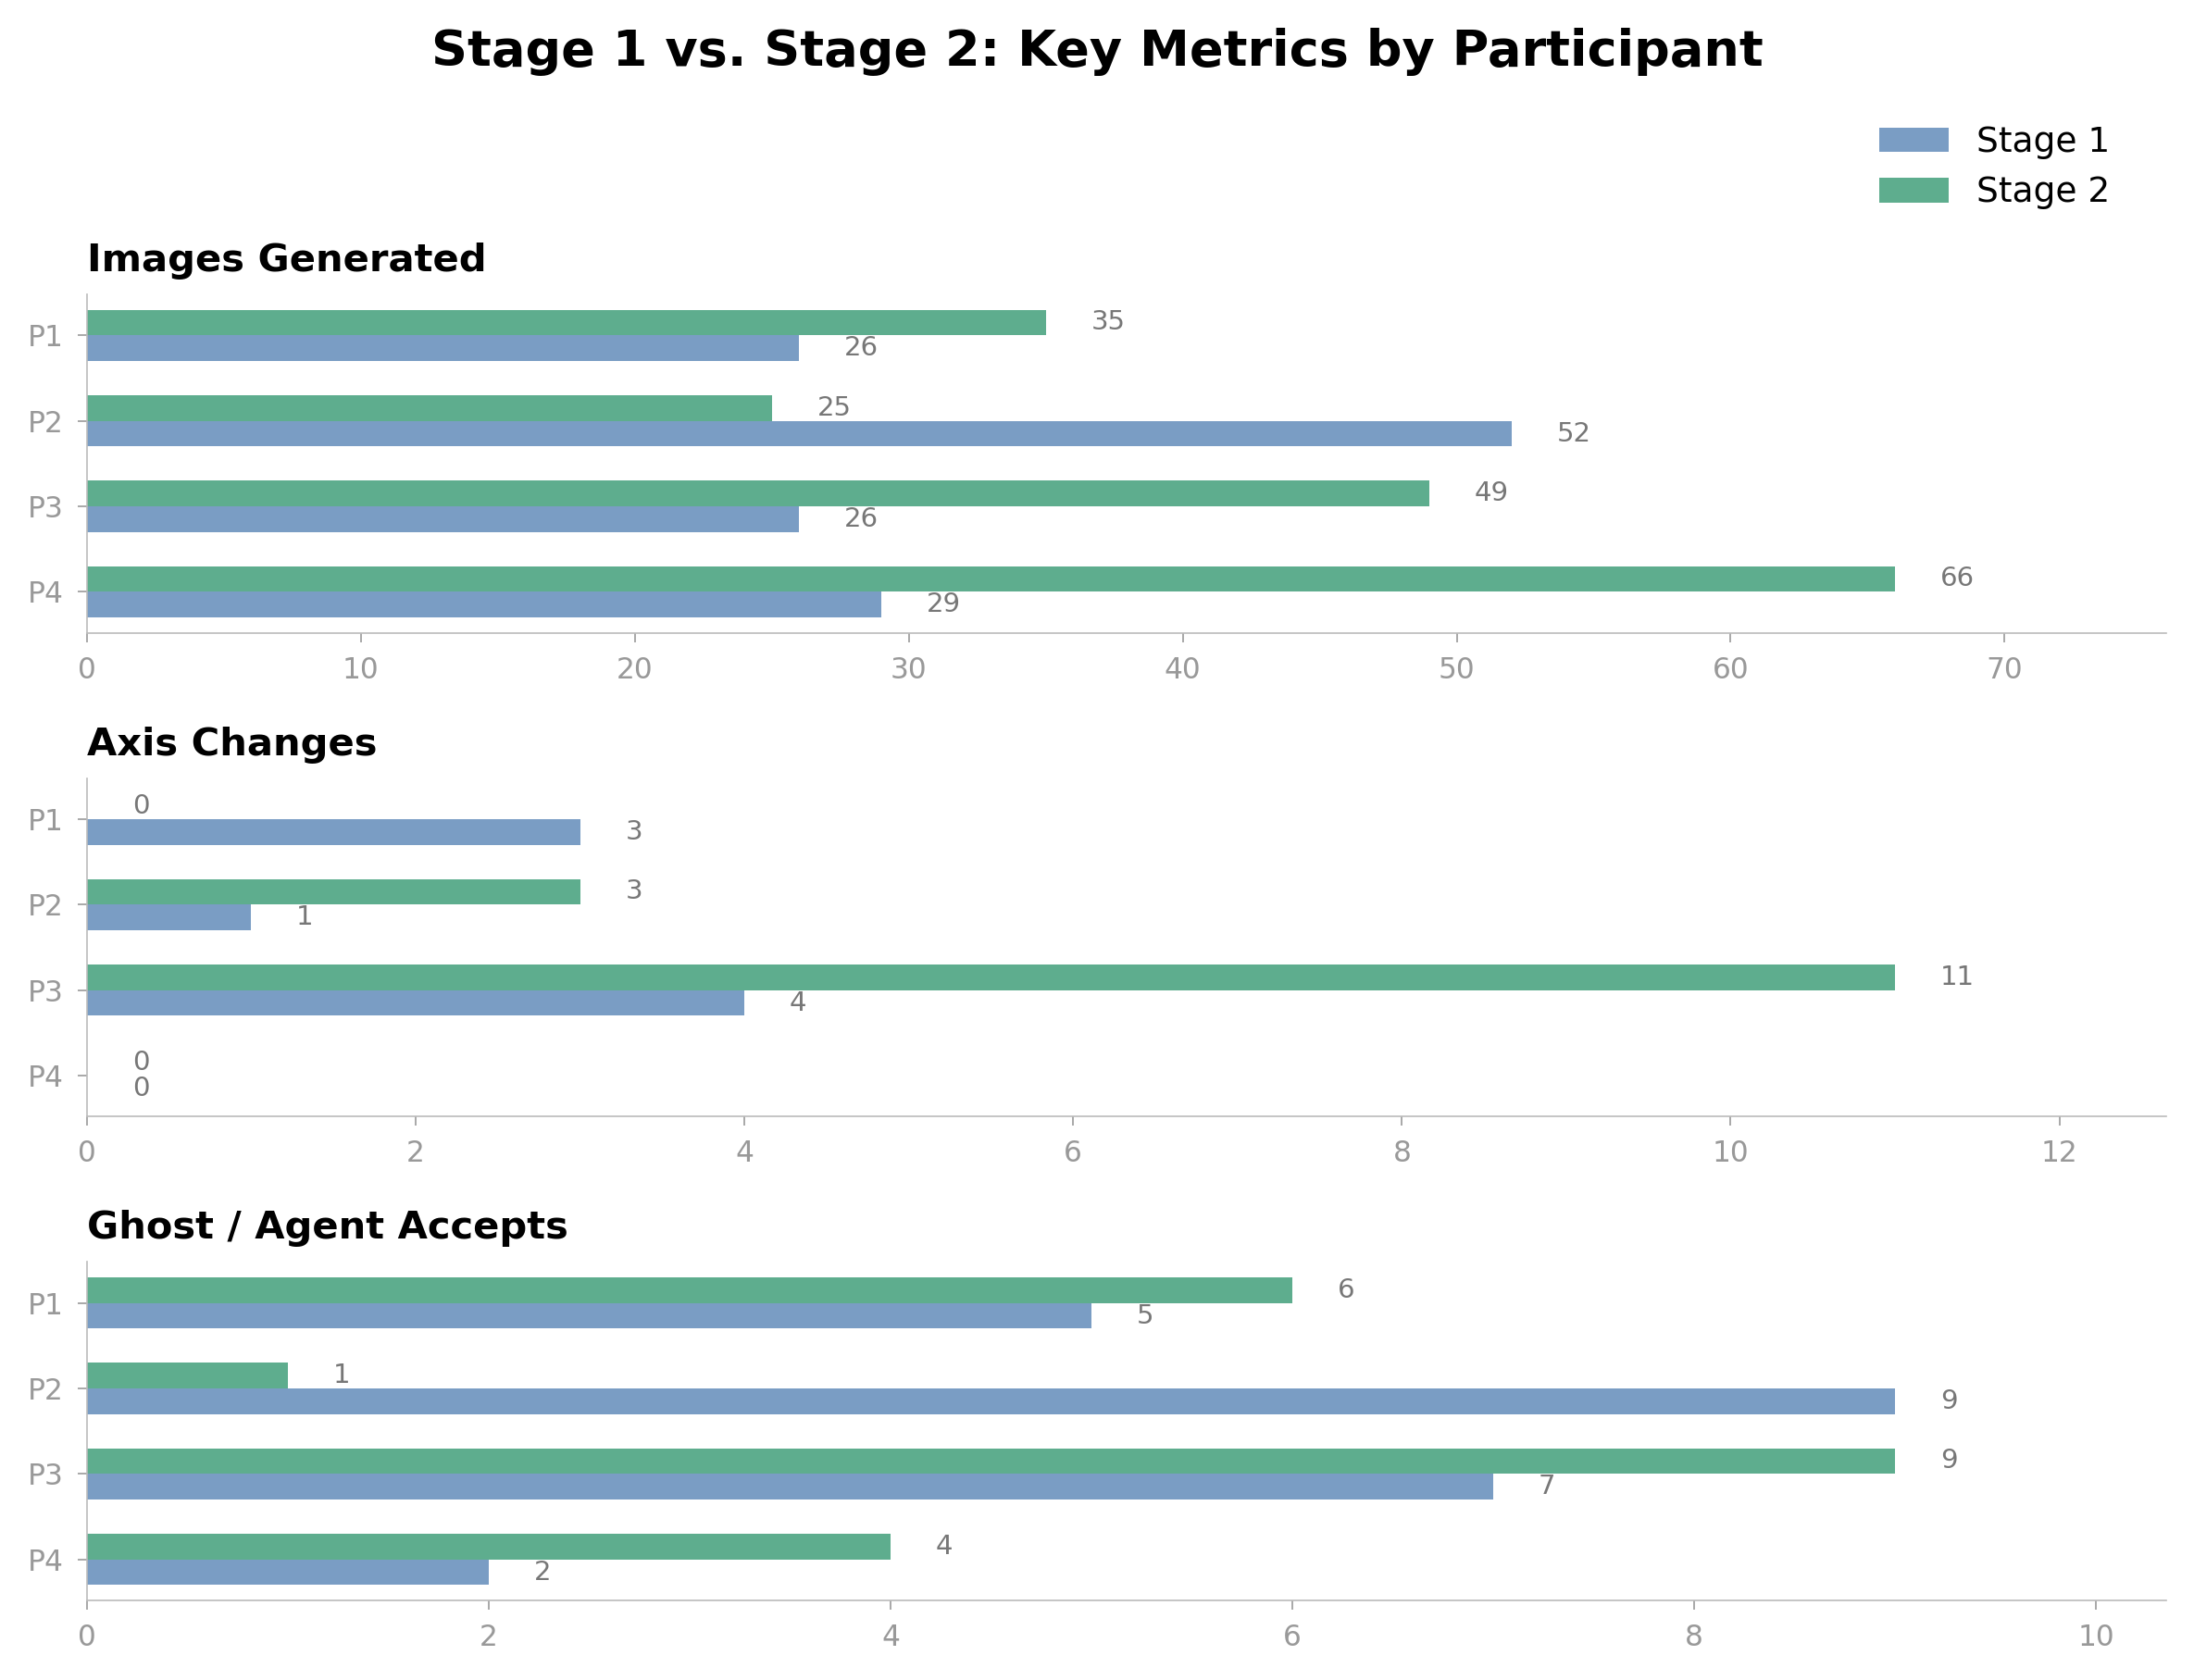
The thesis hypothesis — that legible latent space improves designer creativity over a flat generative tool — is being tested with a multi-participant study running through Spring 2026. Each participant accesses a personal URL of the form /?participant=Name. The backend's X-Participant-Id header routes each request to an isolated AppState via FastAPI's ContextVar middleware.
Every interaction is recorded as a JSONL line per participant — sessions, generations, selections, axis edits, feedback notepad entries. JSONL because it's append-only, line-by-line analyzable, and survives crashes. The notepad floats as a quick-note FAB so designers can leave qualitative breadcrumbs without breaking flow.
Quantitative measures: time-to-first-keep, branch depth, axis-edit frequency, generation-to-selection ratio. Qualitative material: feedback notepad entries plus post-session interviews. Together they're the spine of the thesis writeup.
Longitudinal evolution
Per-participant composites across thesis stages, each capturing the canvas, lineage, and generation history of a single design session.
This website is a live demo of the method.
The hero on the homepage is the same projection pipeline described above, applied to a different dataset: my own portfolio. Each project sits in semantic space along designer-typed axes. Drag the axes, retype the labels, and the projects rearrange. The method is the medium.
Switch on thesis mode at the top of the homepage hero, type your own axes, and watch every project reposition itself by meaning. It is the smallest possible version of Semantic Canvas — and it works on any image collection.
See the live method on the homepageCODE
View on GitHub
Full implementation, models, and evaluation
LIVE TOOL
Coming Spring 2026
Public deployment on Railway after study completes