An interactive dashboard comparing tech and design job markets — revealing how skill requirements, salaries, and remote availability interplay across geography. Built for cross-field job seekers navigating the transition.
Live demo · Team: David Chen, Risa Xie.
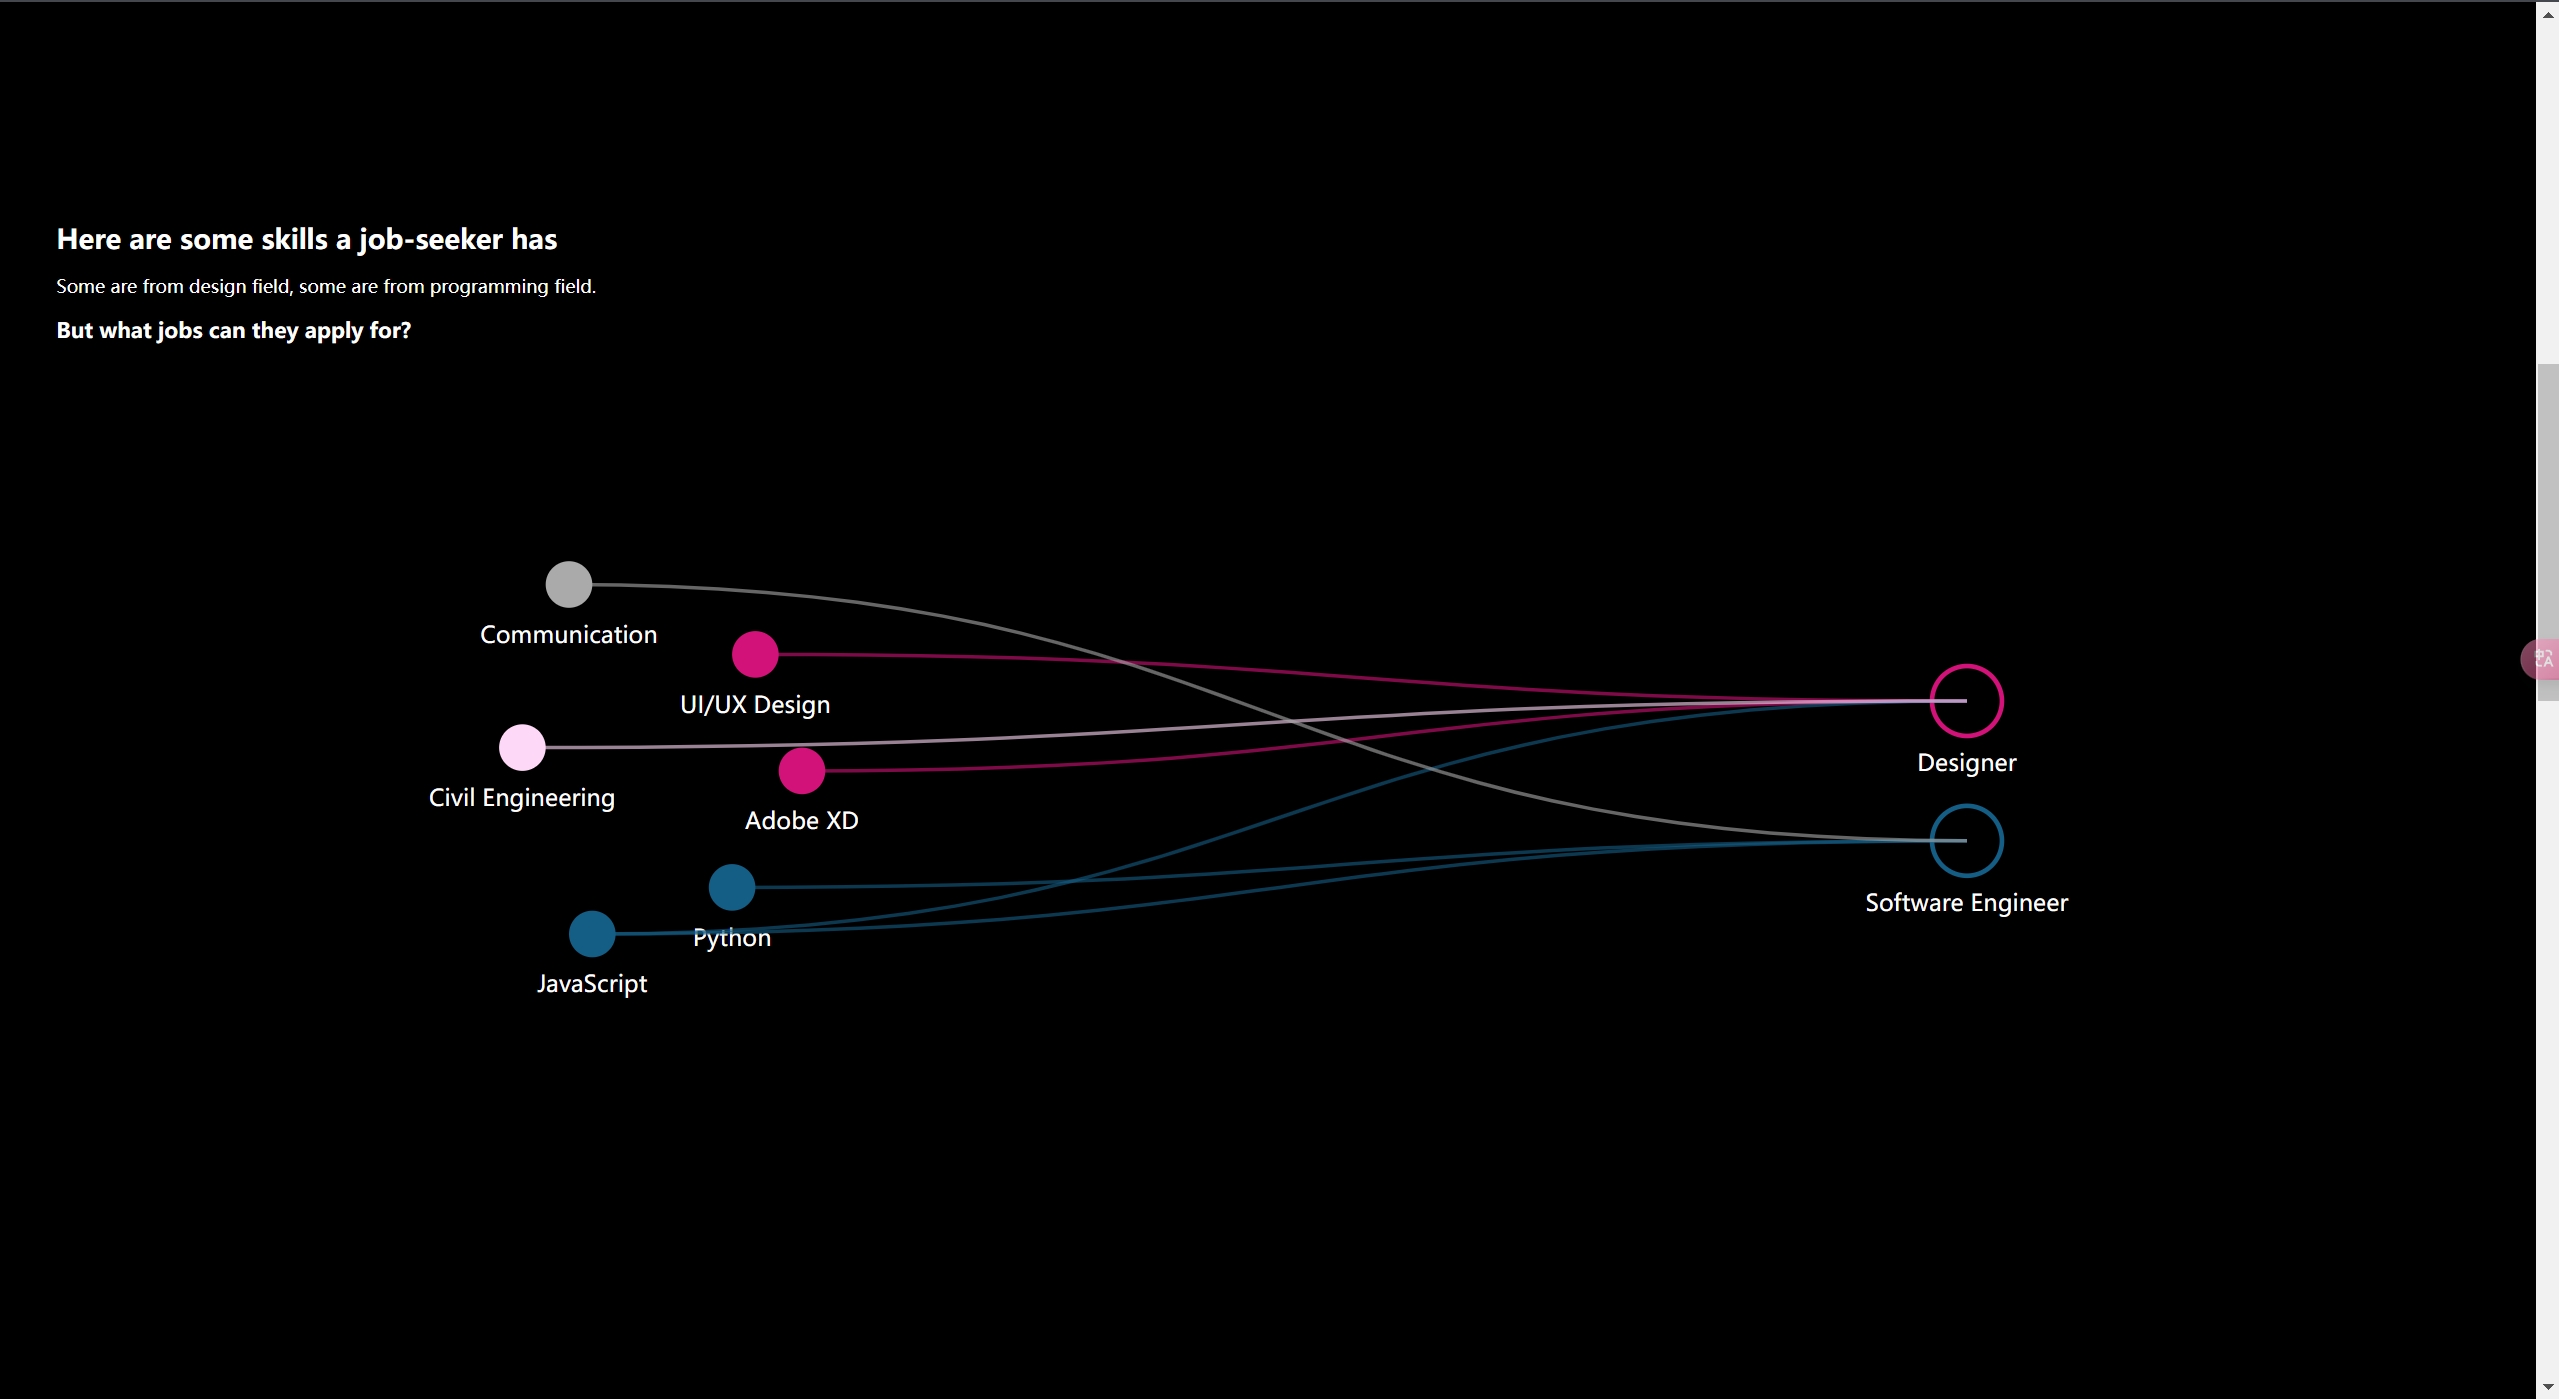
The dilemma for cross-field job seekers
The labor market is evolving at an unprecedented pace. Emerging technologies and shifting demands are driving individuals to acquire new skills and transition into unfamiliar fields. This phenomenon is particularly evident among cross-field job seekers — those venturing into careers that differ significantly from their previous experience. While these individuals bring diverse perspectives and creativity, they often face challenges in aligning their skills with job requirements and navigating the vast job landscape.
In this study we provide a data-driven understanding of the broader categories of jobs and how specific skills — particularly in tech and design — connect to these roles. We analyzed LinkedIn job postings from 2023, extracting skills from job descriptions and categorizing them into nine overarching skill groups (e.g. “Data Analysis”, “Programming”) and 23 job categories (e.g. “Cloud DevOps”, “Software Engineer”, “Product Management”). Using a consistent keyword-mapping process, we ensured clarity and accuracy in linking skills to jobs. Our visualizations focus on revealing the connection between tech/design skills and job categories, as well as providing insight into salary trends and geographic distribution.
Key results
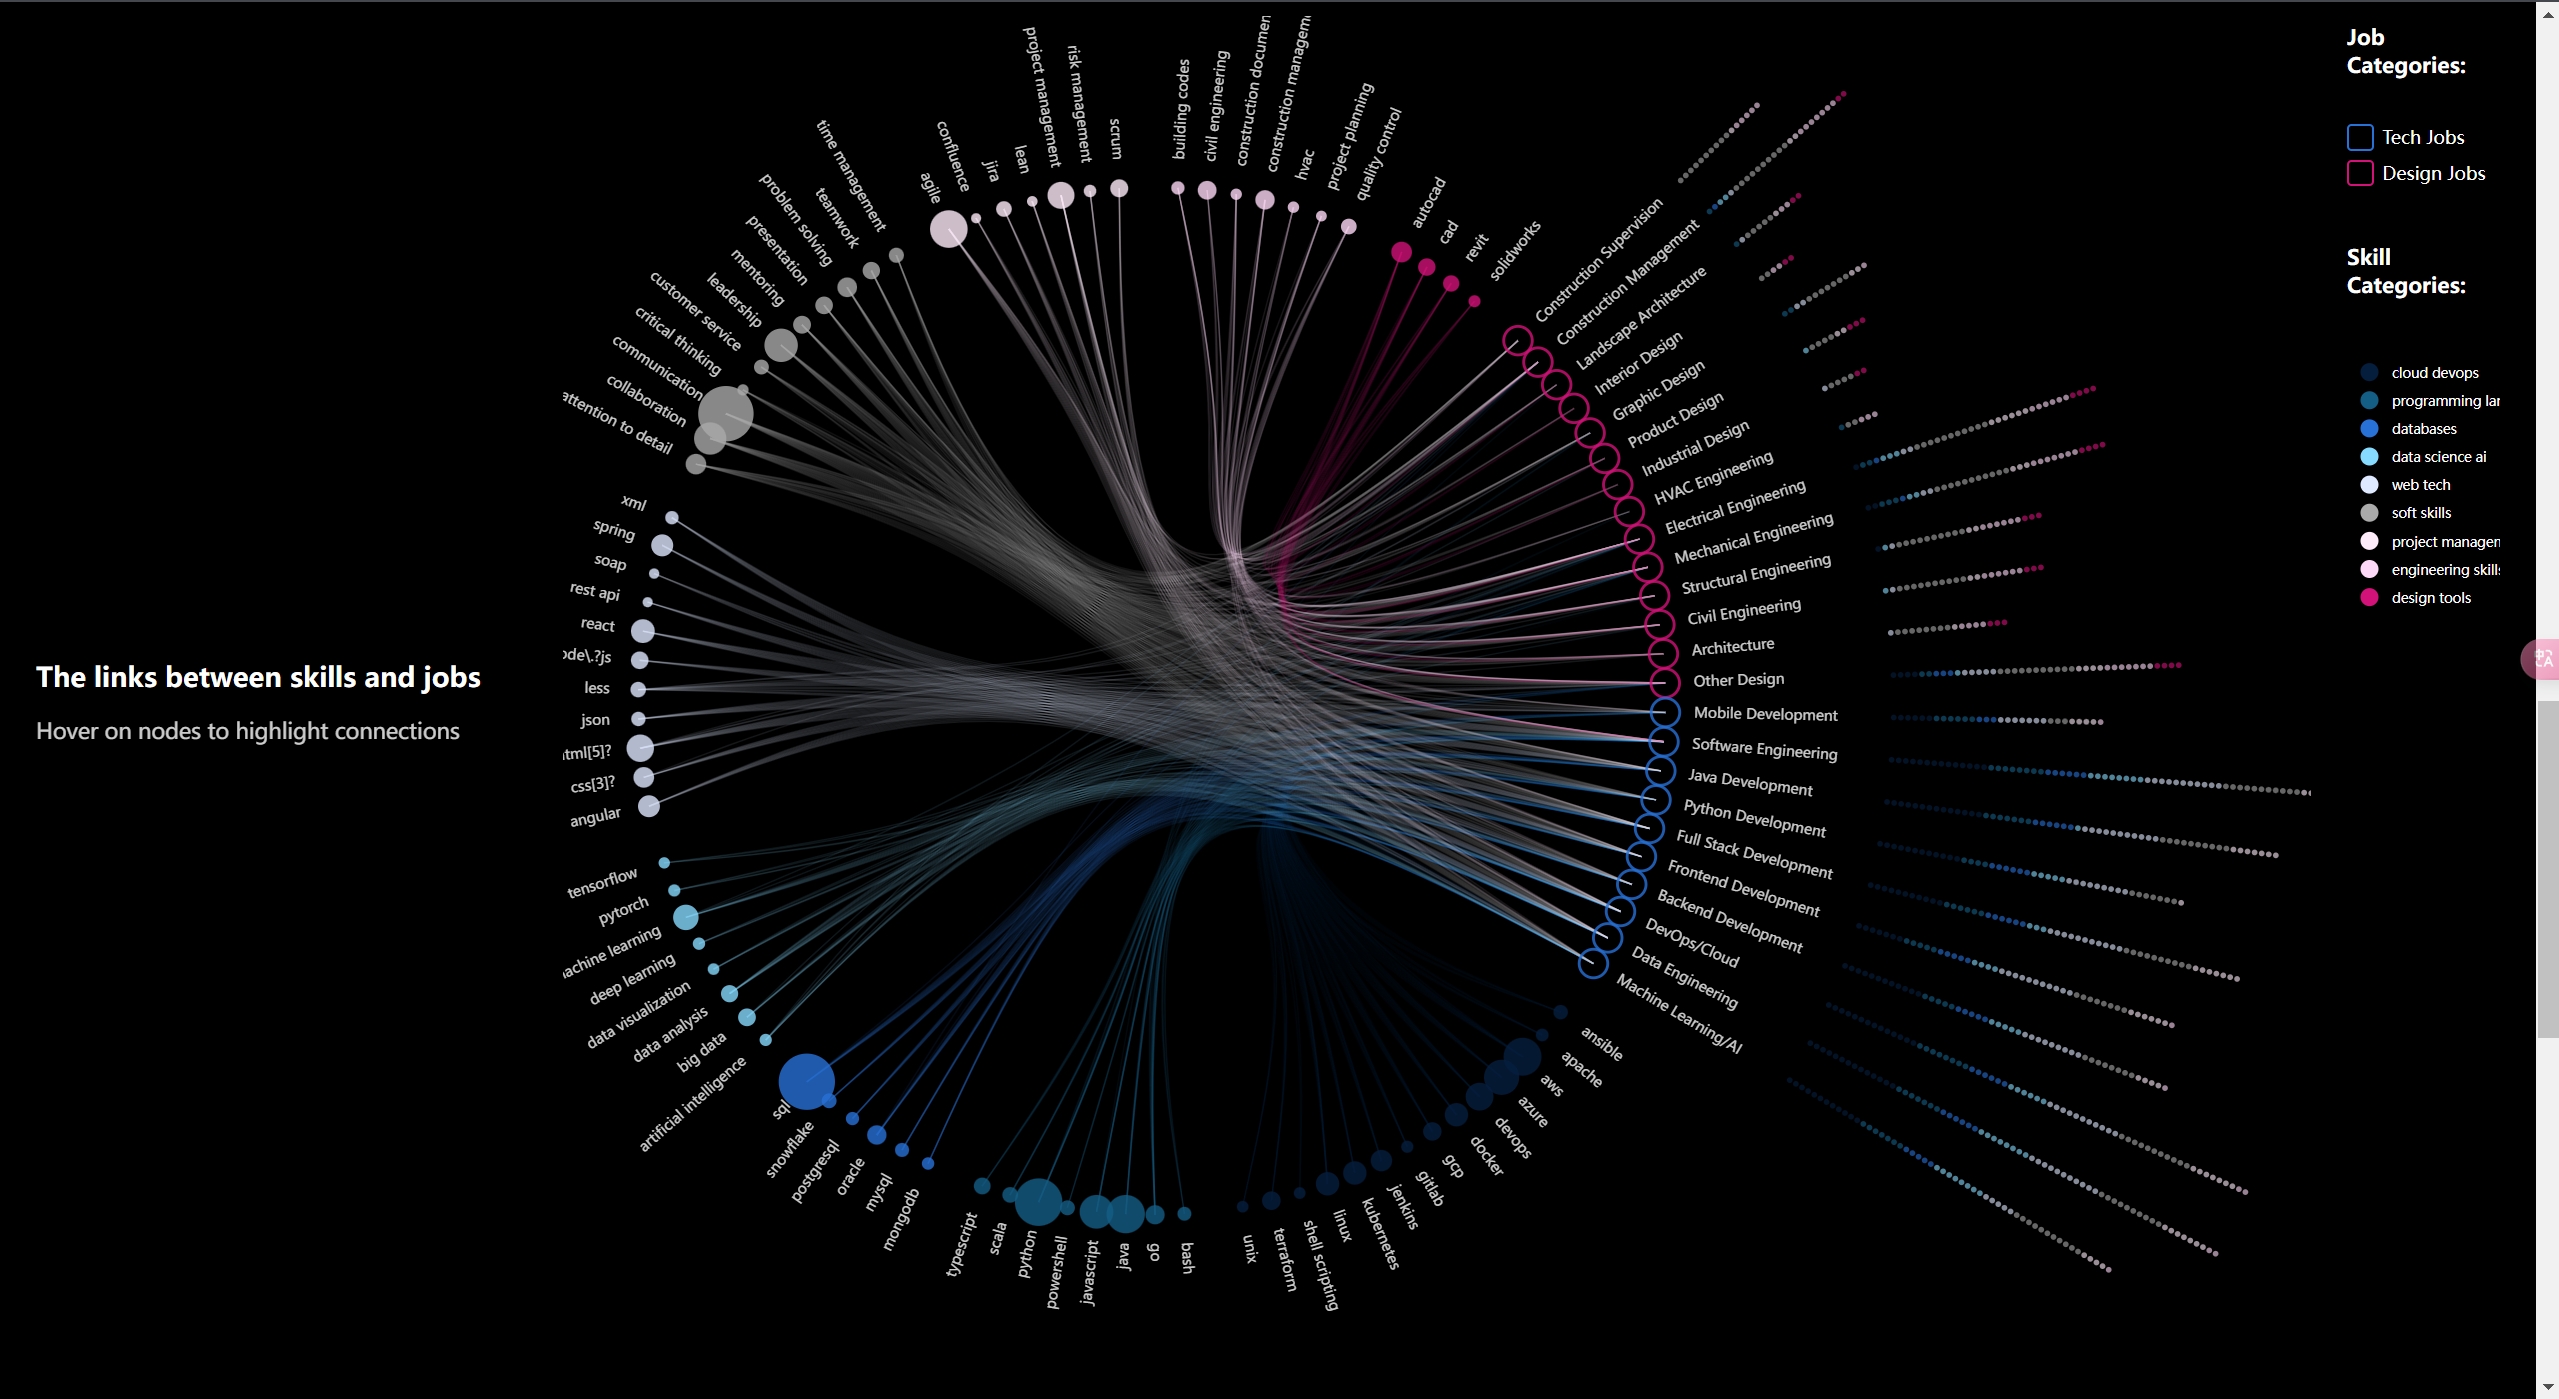
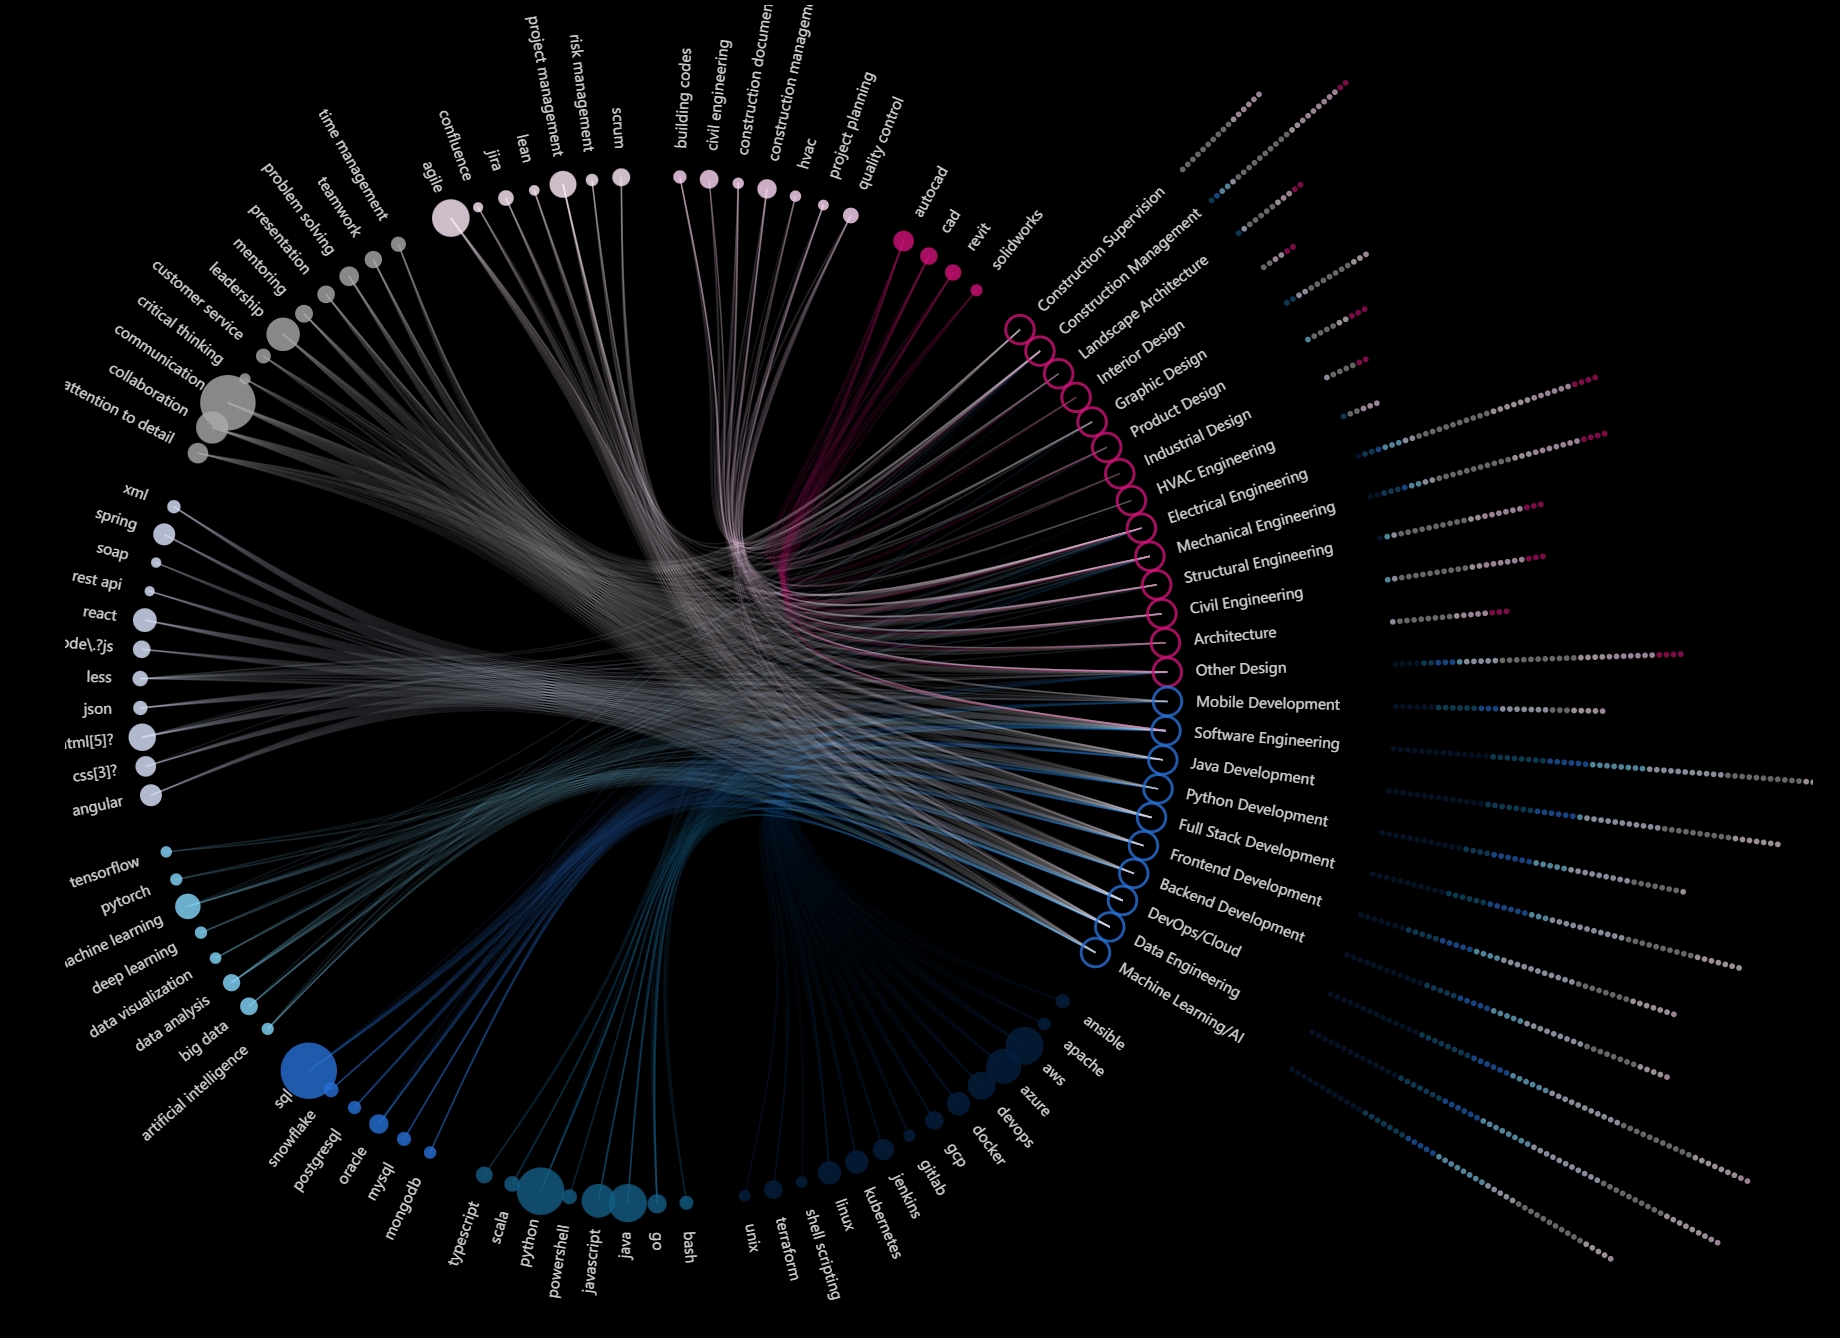
Observation 1 — preference for both design and technical skills varies across job categories
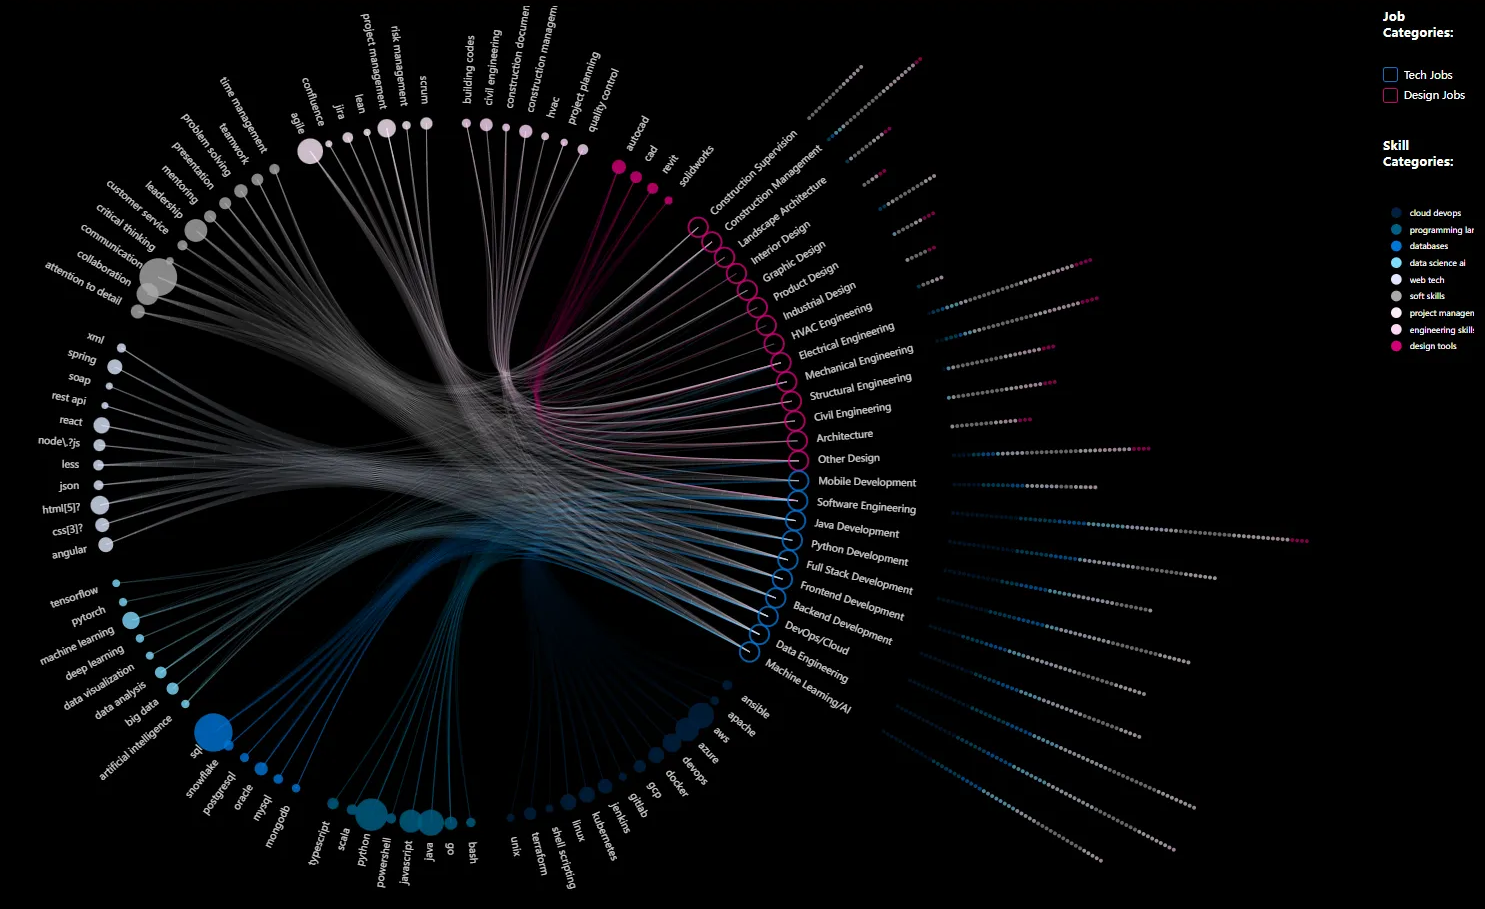
- Certain roles — Software Engineer in particular — demonstrate a strong preference for both technical and design skills, evident from the dense network of connections linking both skill types. Other roles like Interior Design predominantly emphasize design-specific skills with little to no overlap with technical skills.
- Overall, technical jobs tend to require a broader and more diverse set of skills than design jobs. This discrepancy could stem from:
- Tech stack variability — in technical fields, differentiation among tools and frameworks is pronounced. There are over 20 variations in software scaffolding tools alone (e.g. React, Angular, Node.js), whereas design focuses primarily on a few key solutions like Adobe and Figma
- Data bias — the dataset itself contains fewer design job postings than technical roles, leading to the omission of less frequently mentioned design skills (filtered out for having fewer than 50 mentions)
Observation 2 — tech jobs have more openings and more remote positions than design
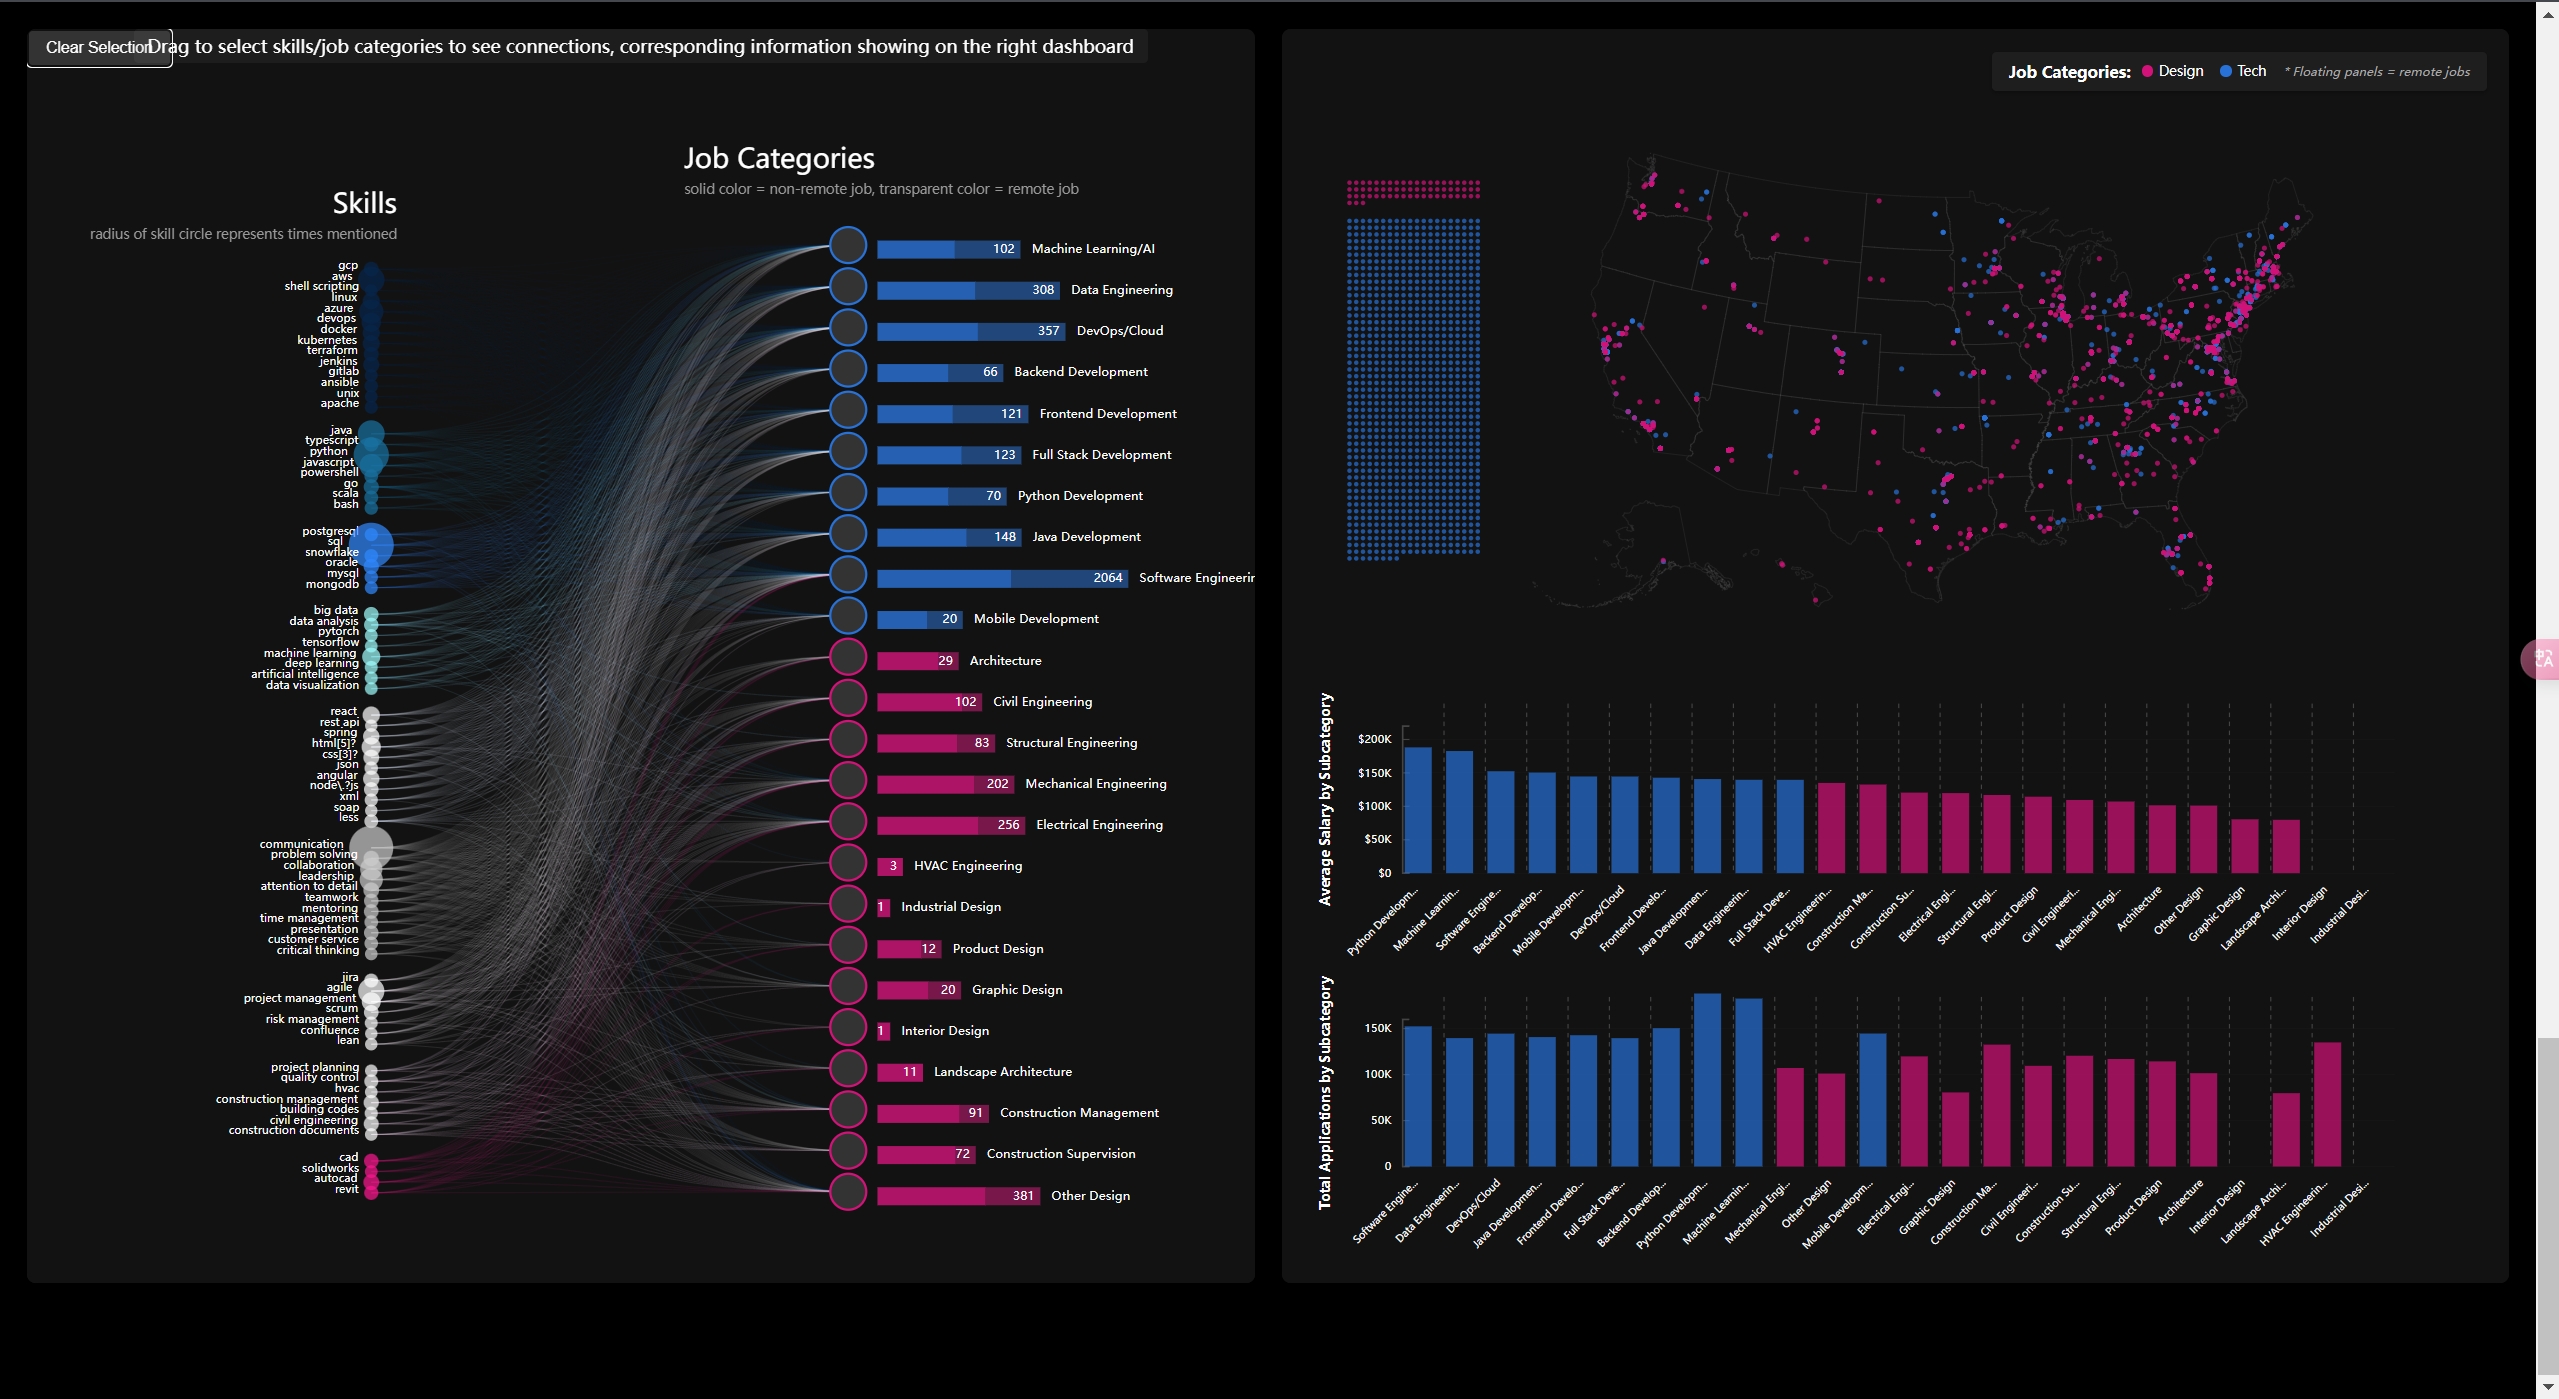
To compare tech and design-related jobs by data count, we mapped total job counts in subcategories and their remote positions. We used a log scale to prevent software engineering from skewing results.
The data shows:
- Tech jobs significantly outnumber design job openings
- About half of tech positions offer remote work, compared to less than 20% for design
- Some design job categories have no remote positions in our sample dataset
- Software engineering leads the tech category with over 2,000 job postings
- Electrical and mechanical engineering are the largest design categories
Some categories show very low posting numbers — just 3 for HVAC engineering and 1 for interior design. The dataset isn’t comprehensive, but the trend pattern is robust.
Geographic distribution: Both design and tech jobs are concentrated in major cities along the east and west coasts, with the highest concentration on the east coast. Design jobs appear more frequently in the Midwest, where tech jobs are scarce. Design positions can also be found in smaller cities that lack tech job opportunities.
Observation 3 — tech jobs have higher salaries and more competition
- Average salary by subcategory: tech-related job categories command the highest average salaries, followed by design-related categories. Backend-related and algorithmically complex jobs offer the highest average salaries, with compensation decreasing toward front-end positions. Within design, technical engineering roles pay the most, while less technical positions like architectural designer and graphic designer have the lowest averages.
- Application volume: some tech job categories receive up to 500 applicants for a single role. Many tech subcategories including frontend development and Python development have at least 25% of positions attracting more than 50 applicants each.
- Design jobs cap at around 50 applications per posting, with the first quartile around 10 per opening. Design positions attract fewer applicants than tech roles.
- Salary distribution: top-paying tech positions can exceed $600,000 annually, with most roles clustering around $150,000. Design jobs cap at approximately $300,000, with the majority falling below $100,000.
Design decisions
Color coding for clarity and accessibility
Distinct colors differentiate between skill categories (tech, design tools) and job types (tech jobs in blue, design jobs in pink). This lets users quickly identify connections and trends at a glance. The consistent color scheme across the dashboard makes navigating complex data intuitive, reducing cognitive load.
Interactive link generation
Hover and multi-select functionality enables users to focus on specific nodes and highlight their direct connections. Users can dynamically explore the relationships between skills, job categories, and other variables. On the main panels we intentionally display only high-level categories to avoid information overflow — users seeking detailed insights can hover to view specific job postings. This balance ensures both macro-level clarity and micro-level depth, making the visualization adaptable to different user needs.
Integrated dashboard linking skills, jobs, geo-info, and salary
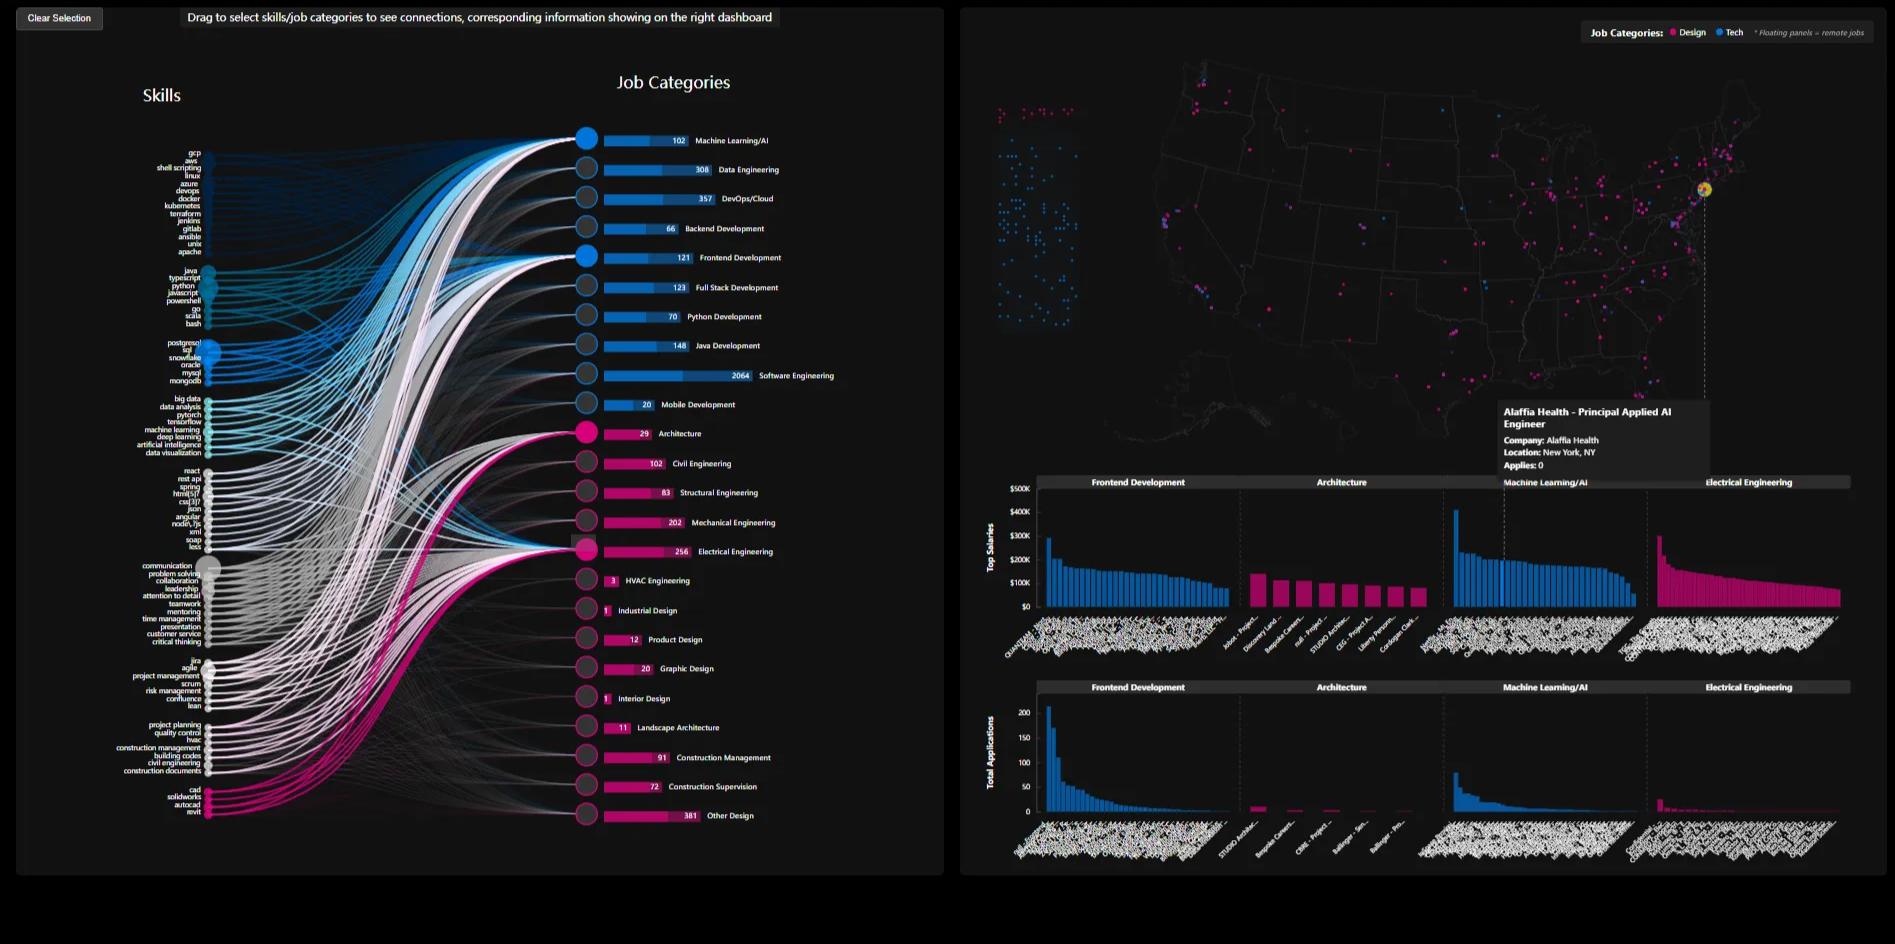
Multiple data dimensions are seamlessly connected — integrating skills and job categories with geographic distribution and average salary. This allows users to explore relationships holistically: how specific skills, job types, and their geographical and salary distributions relate. Interactive linking lets users see how salaries and job locations are interconnected, making it easier to grasp overall trends and variability. Users can compare jobs across categories and use the skill-job connections to understand how different locations impact compensation and opportunities.
Reflection
This project combined personal experience and technical collaboration to address challenges faced by cross-field job seekers. The idea was inspired by Risa’s journey as a design-background student transitioning into tech, with support from David, who shared similar experiences. Together we sourced and cleaned the dataset, with David leading data preprocessing. Visualization tasks were split: Risa created the edge-bundling diagram, David handled the GeoMap, and both collaborated on the skill dashboard. Integrating the dashboard with the GeoMap proved challenging due to differing data structures, so we delegated the task entirely to David while Risa focused on earlier parts of the page.
The project deviated from our original plan to analyze long-term trends due to lack of comprehensive historical data, leading us to focus on high-quality data from the most recent year. This shift provided a clear snapshot of the current job landscape. Looking back, better upfront planning for consistent data sources and reusable components would have streamlined the process. Moving forward, we aim to apply these lessons in future projects, emphasizing a unified global design and deepening our understanding of tools like Svelte and JavaScript for more efficient collaboration and storytelling.
Built for 05-619 Data Visualization, Fall 2024 — Svelte, D3.js, LinkedIn 2023 job dataset.
Links
- Live demo
- GitHub repo
- Notion page (full findings + all figures)
- Local:
W:\CMU_Academics\Fall 2024 CMU\Data Visualization\Skill-Bridge-DataVis\