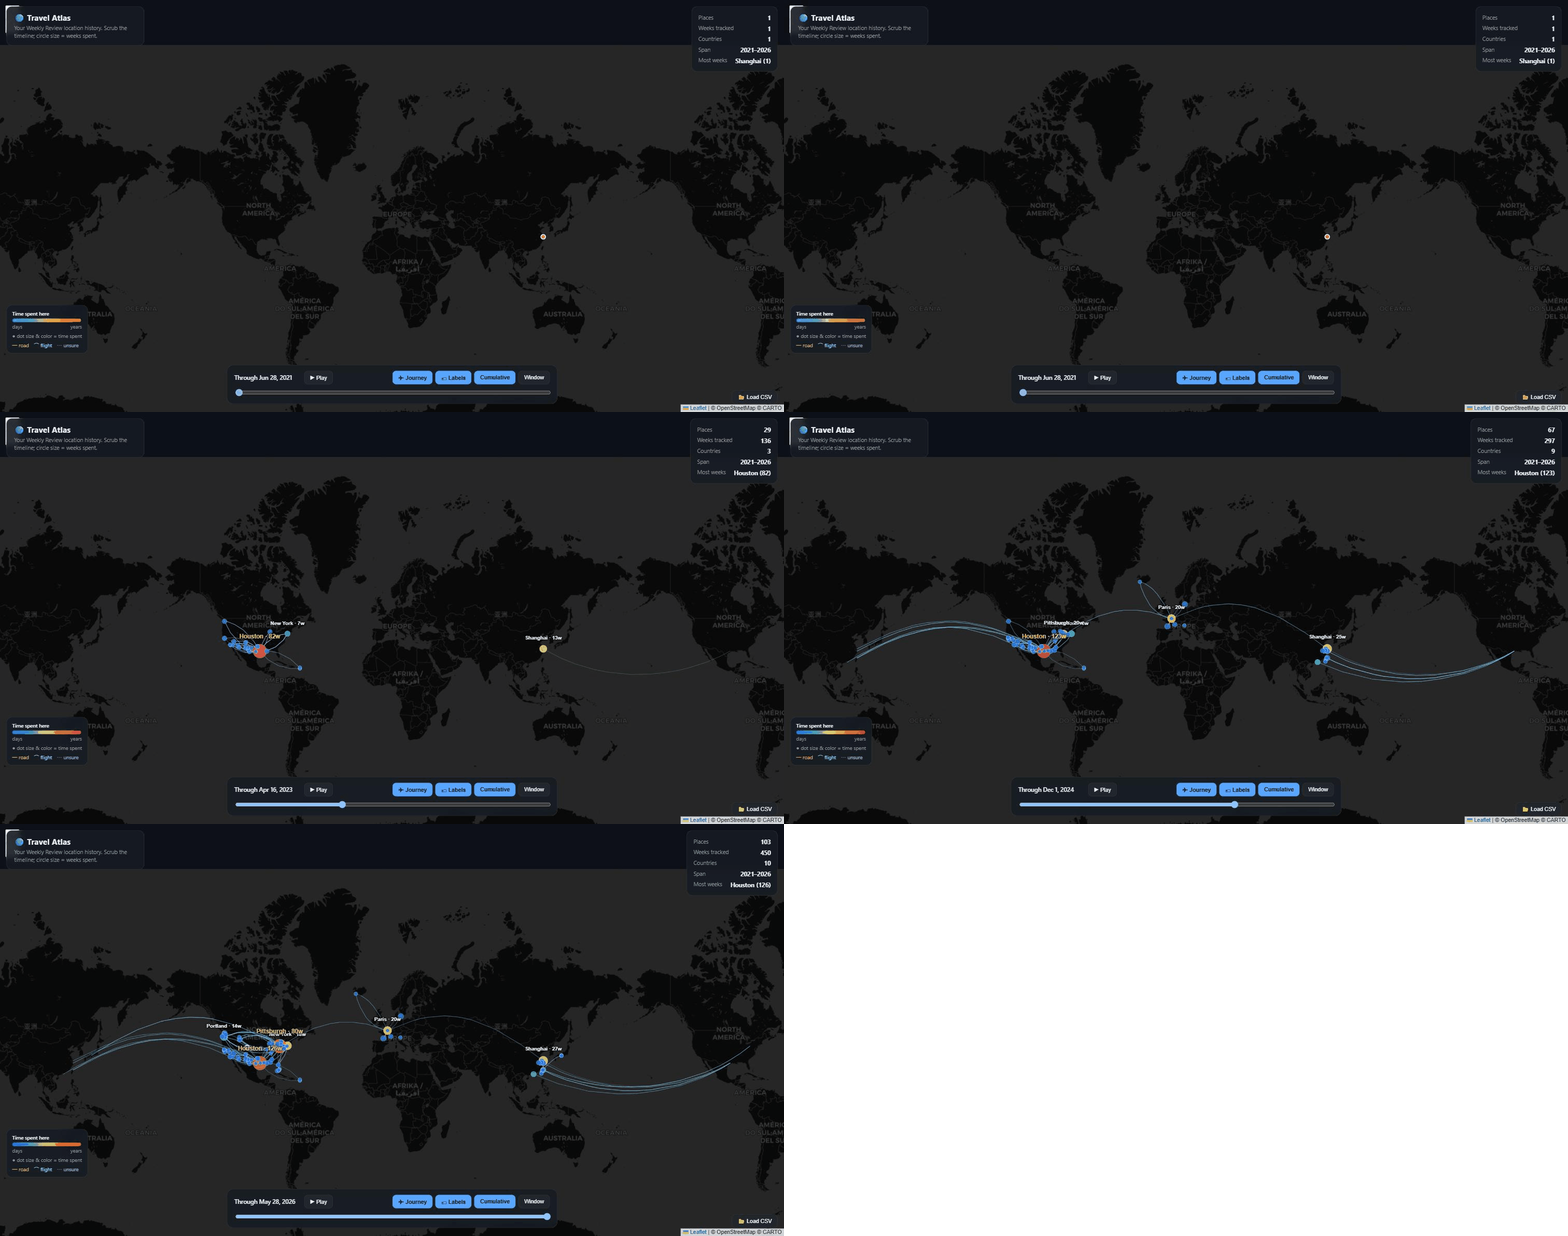
Built entirely from my own data — an interactive world map of everywhere I’ve lived and traveled from 2021 to 2026, with no manual entry and no spreadsheet. A timeline scrubber animates the journey week by week; each dot is a place, sized and colored by how many weeks I spent there. It surfaces 103 places across 10 countries and 395 dated events, all reconstructed from records I’d already written and photos I’d already taken.
▶ Launch the interactive map → — or explore it right here:
The problem
I had five years of movement — undergrad in Houston, a study-abroad semester in Paris, grad school in Pittsburgh, an internship in Portland, summers in China, national-park road trips — but no single record of it. The history was latent: scattered across ~249 Notion Weekly Reviews, ~1,330 Daily Reviews, and ~73,000 photos in iCloud. None of it was in a form a map could read.
The interesting constraint was not building a travel tracker from scratch — it was recovering a travel history I never explicitly logged, from data I generated as a byproduct of other habits, without re-typing any of it. Every place on the map has to trace back to something I actually wrote or a photo I actually took.
How it’s built
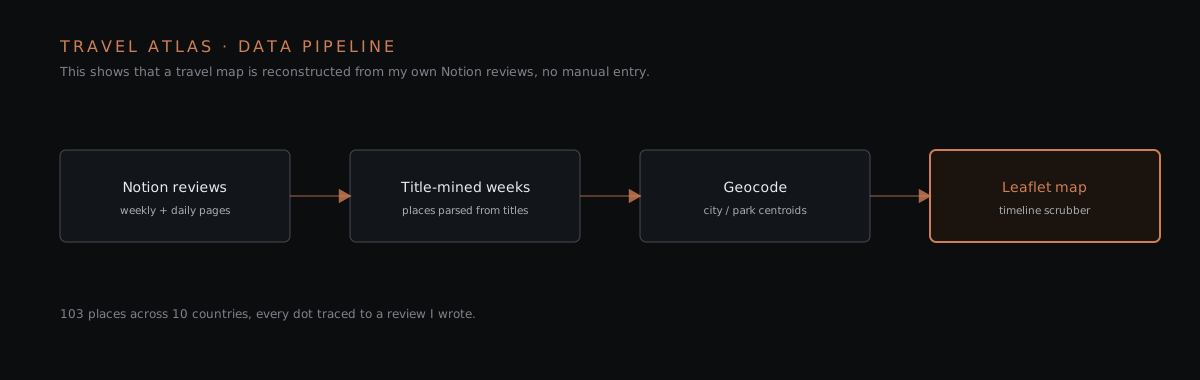
travel-data.json that drives the map.The system has two independent data sources feeding one merged dataset, then a single-file client that renders it.
Source A — mining Notion via MCP
The location history is mined from my Notion Weekly and Daily Reviews through the Notion MCP — not a CSV export, not the REST API by hand. The Weekly Review DB (~249 pages) is enumerated with date-filtered search, then each page title is mined for location names. Weeks with untitled pages get a home base inferred by era (e.g. “this stretch of 2022 = Houston”).
A second pass over ~1,330 Daily Reviews catches trips the weekly titles missed —
the West Texas desert loop, the China summers, national-park stops, cross-country
road-trip segments — yielding 146 trip-days. Titles like 9.27-10.3, 2021
are parsed into a real date plus a place, so the data lands as clean
{date, places, label} events.
Source B — a metadata-only photo harvest
A second layer harvests photo geolocation from my iCloud library, metadata
only (icloud_metadata.py, built on pyicloud). It pages through all
73,009 items and pulls GPS + date without ever downloading a single
photo — the privacy-preserving part is the whole point.
The non-obvious engineering was where the GPS actually lives. On this account
it is not in the expected locationLatitude / locationEnc fields. It’s
buried in the master record’s mediaMetaDataEnc — a base64-wrapped binary
plist whose {GPS} dict holds Latitude / Longitude plus LatitudeRef /
LongitudeRef. The extractor decodes that blob and applies the S/W sign flips;
a single null-island (~0,0) GPS-error point is dropped client-side. Result:
22,663 geotagged items out of 73,009, collapsed into 4,122 rounded density
cells (the rest are screenshots and receipts with no location).
# where the GPS actually was — not the obvious field
media = _fval(fields, "mediaMetaDataEnc")     # base64 str / bytes
pl    = plistlib.loads(base64.b64decode(media))  # binary plist
gps   = pl.get("{GPS}") or pl.get("GPS") or {}
lat, lng = gps["Latitude"], gps["Longitude"]
if gps.get("LatitudeRef","N").upper().startswith("S"):  lat = -abs(lat)
if gps.get("LongitudeRef","E").upper().startswith("W"): lng = -abs(lng)
Merge + correction
merge.py is an idempotent rebuild — it preserves the pure-weekly dataset in
weekly-data.json, then always regenerates travel-data.json from
weekly-data.json + daily-raw.json so a re-run never double-counts. It sorts
all events by date and dedupes the place-geocode tables.
It also encodes one real data-quality fix. The era-inference had mislabeled my
China summers as Houston — I was home in Shanghai, not Texas. merge.py
reassigns those untitled weeks (I arrived Houston 2021-08-23; the corrected
in-China windows are 2021-06-29 → 08-22 and 2023-06-11 → 08-13), moving
17 weeks from Houston to Shanghai and tagging them (China summer).
| Stage | Source | Output |
|---|---|---|
| Weekly Reviews | ~249 Notion pages (MCP) | home-base weeks |
| Daily Reviews | ~1,330 scanned | 146 trip-days |
| Photo metadata | 73,009 iCloud items | 22,663 geotagged → 4,122 cells |
| Merge + correct | merge.py | 395 events · 103 places · 10 countries |
The map itself
The client is a single self-contained index.html — Leaflet on a CARTO dark
basemap, no build step — that auto-loads travel-data.json. If that’s absent it
falls back to a sibling CSV export or a small demo set, and a Notion CSV can be
dropped directly onto the map (it auto-detects the location and date columns
against the known-places table).
Concrete rendering decisions:
- Weight encoding. Each place is a
circleMarkerwhose radius and color both map to weeks spent (r = min(2.5 + √n·1.5, 15), plus a blue→teal→yellow→orange→red ramp), so the places that mattered most — Houston (126 weeks) and Pittsburgh (80 weeks) — read instantly against one-off trips. - Journey mode. Consecutive locations are joined by quadratic-bezier arcs
classified as road / flight / uncertain — inferred from great-circle
distance and, when a photo day-track is present, travel speed
(
km/day). Flights bow high in cyan; road hugs the ground in amber. - Timeline scrubber. Dragging the slider (or hitting Play) walks the 395 events and re-aggregates dwell time per frame, in either a cumulative view or a 6-week trailing window — so you watch the trail build and fade.
- Legibility. Exact Notion spellings are canonicalized through an alias map
(my own
Santa Barbra,Harrisburgh,Yellow Stone National Park), and city labels declutter below a per-frame threshold so early trip dots don’t crowd.
Honest caveats
The sources are transparent about their limits, and so is the map. Home-base weeks are era-inferred, not per-day GPS; some bulk-backfilled trip days carry ±a-few-days dates (the sequence is reliable, the exact day may not be); and a trip only appears if I wrote it into a weekly or daily title. Places geocode to city or park centroids — right for a travel map, not GPS-exact. These are noted rather than hidden because the whole exercise is about honest provenance.
Why I made it
Mostly for myself — a compounding record of a decade of moving around, and a way to enrich my second brain with a durable, queryable travel profile. But it’s also a small case study in the thing I like doing most: turning messy personal data into a legible, interactive picture using the tools I already live in — Notion, a bit of Python, and a map — while being disciplined about privacy (metadata only) and provenance (every dot traces to a real source).